
Fig. 3.
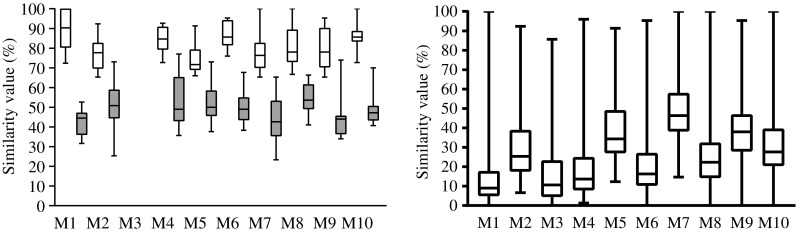
a Test strains that were identified to the expected MALDI-type according to PFGE-type (n = 160). The figure shows the difference of peak matching values (%) between the first and second best matching MALDI-types. Statistics were calculated with the Mann-Whitney test. b Peak matching value of all analysed test strains to all MALDI-types