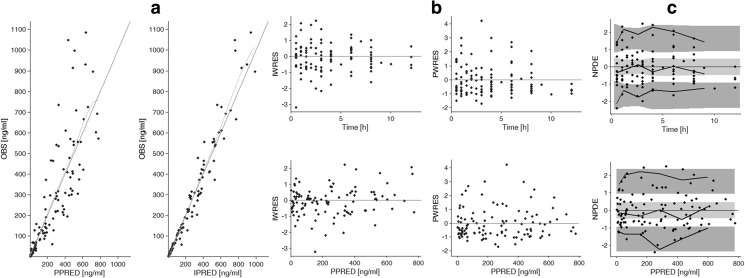
Fig. 3.
Goodness-of-fit plots for the final pharmacokinetic model. Panel A illustrates observed (OBS) vs. population predicted (PPRED) treosulfan concentrations and OBS vs. individual predicted (IPRED) treosulfan concentrations with an identity line and smooth. Panel B presents individual-weighted residuals (IWRES) vs. time and PPRED, population-weighted residuals (PWRES) vs. time and PPRED. Panel C presents normalized prediction distribution errors (NPDE) vs. time and PPRED with bold lines as 5th, median and 95th percentile of observed concentrations, light gray area as 50% interval of simulated data and dark gray areas as 95% intervals of simulated data

