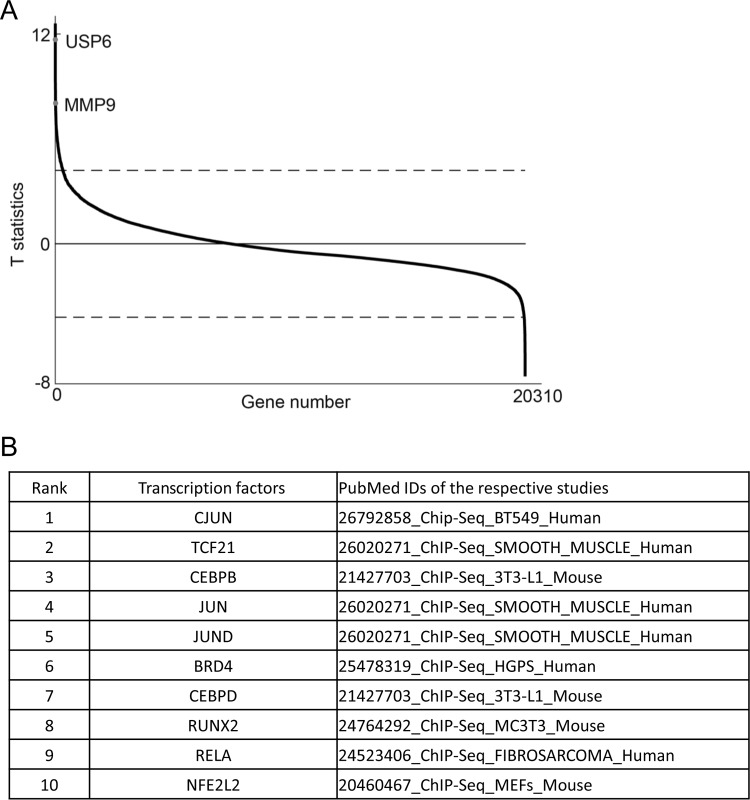
FIG 6.
c-Jun is potentially involved in USP6 translocation nodular fasciitis disease. (A) The T statistics (y axis) of all the genes measured (x axis) in the data set were plotted. The dashed lines represent the threshold (FDR < 0.01) used to identify DE genes. DE genes above or below the dashed lines were upregulated or downregulated in the nodular fasciitis group compared with the “other tumors” group. The points representing two genes, USP6 and MMP9, are labeled. T statistics reflect the degree of expression difference of a gene between two groups of samples. The larger the absolute value of a gene's T statistic is, the greater the expression difference is. (B) Chromatin immunoprecipitation (ChIP) enrichment analysis of aberrantly upregulated genes. The aberrantly upregulated genes in a USP6 translocation nodular fasciitis sample from the ChEA 2016 gene set library with FDR values of <0.01 were analyzed using Enrichr and the combined-score ranking method. The top 10 ranked (by P value) transcription factors are shown (see Tables S1 and S2 in the supplemental material).

