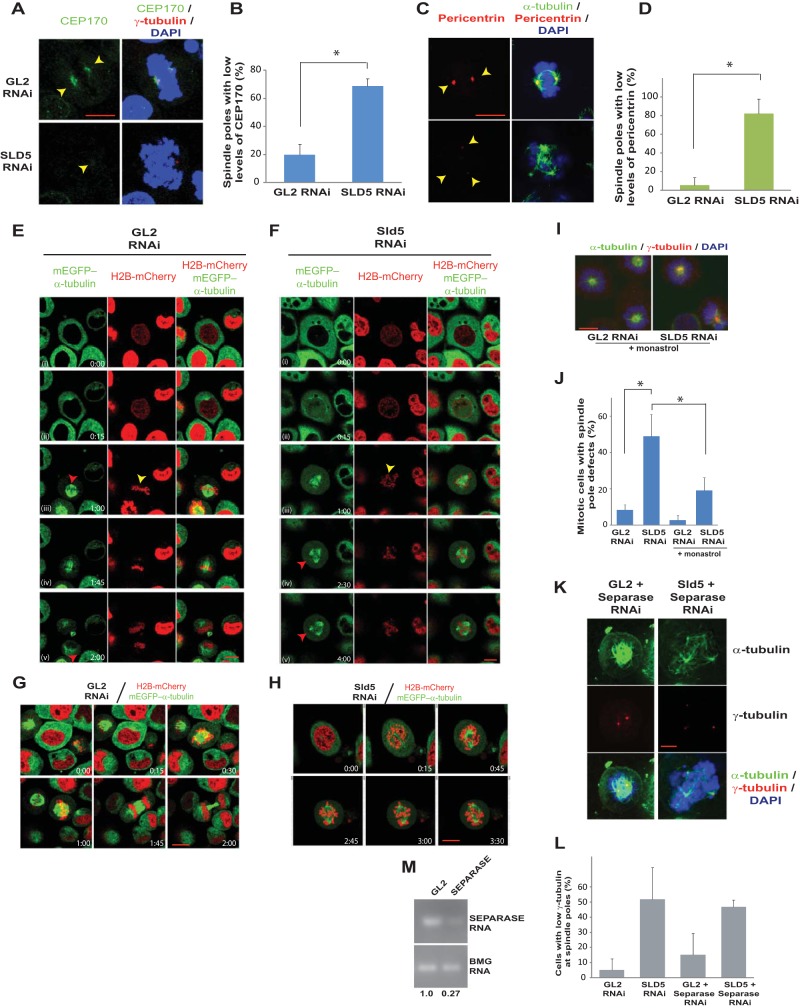
FIG 10.
Spindle pole fragmentation due to Sld5 depletion is preceded by the presence of unaligned chromosomes. (A to D) HeLa cells were transfected with control GL2 or SLD5 siRNA and costained for two structural centrosomal proteins, Cep170 (A, green) or pericentrin (C, red), in combination with γ-tubulin (red) or α-tubulin (green), respectively, as indicated. GL2 or SLD5 siRNA-transfected cells were surveyed to identify spindle poles with low levels of Cep170 or pericentrin staining, which was confirmed by NIS Elements software for multiple examples to be less than 50% of the mean intensity of the signal observed in the control cells. Quantification of panels A and C is shown in panels B and D, respectively. The data are represented as the means and SD of the results of two independent experiments, with more than 20 cells analyzed in each sample for the levels of Cep170 and pericentrin signals (*, P < 0.05). (E and F) HeLa cells stably coexpressing H2B-mCherry and mEGFP–α-tubulin were transfected on three consecutive days with control GL2 or SLD5 siRNA, followed by live-cell imaging. Selected frames at the indicated time points are shown (live-cell capture is shown in Movies S3 and S4 in the supplemental material). In row iii of the control GL2 samples, symmetric spindle poles (red arrowhead) and chromosomes aligned at the metaphase plate (yellow arrowhead) that result in equivalent cytokinesis are visible. In row iii of the Sld5-depleted samples, lagging or unaligned chromosomes are visible (yellow arrowhead), though the spindle poles appear to be normal. In rows iv and v, the appearance of supernumerary spindle poles is marked by red arrowheads. (G and H) Live-cell imaging of GL2 or SLD5 siRNA-transfected cells stably coexpressing H2B-mCherry and mEGFP–α-tubulin obtained from an independent experiment (see Movies S5 and S6 in the supplemental material) different from that shown in panels E and F. In panel H, lagging chromosomes are visible, followed by the appearance of supernumerary spindle poles. (I) Spindle pole defects observed after monastrol treatment, demonstrating that centriole splitting occurs after centrosome separation at prophase. Shown are merged images of control GL2 or SLD5 siRNA-transfected cells costained for α-tubulin (green) and γ-tubulin (red) and for DNA with DAPI (blue) after incubation with monastrol for 4 h. (J) Quantification of the spindle pole defects observed in panel I. The data are represented as the means and SD of the results of three independent experiments, with more than 20 cells analyzed in each sample (*, P < 0.05). (K and L) Codepletion of separase does not prevent spindle pole fragmentation in Sld5-depleted cells. HeLa cells were transfected with control GL2, SLD5, or SEPARASE siRNA as indicated, with the combined concentration brought to 80 nM with GL2 siRNA. The cells were fixed and costained for α-tubulin (green), γ-tubulin (red), and DNA (blue). The quantification is shown in panel L. The data are represented as the means and SD of the results of two independent experiments, with more than 20 cells analyzed in each sample. The t test showed that SLD5-plus-SEPARASE samples were not significantly different from the SLD5 samples (P = 0.77). (M) Decrease of SEPARASE mRNA confirmed by reverse transcriptase PCR. The numbers indicate the mRNA levels following specific siRNA-mediated depletion relative to control GL2 siRNA-transfected cells. BMG served as the internal RNA-loading control. Scale bars, 10 μm.

