FIG 9.
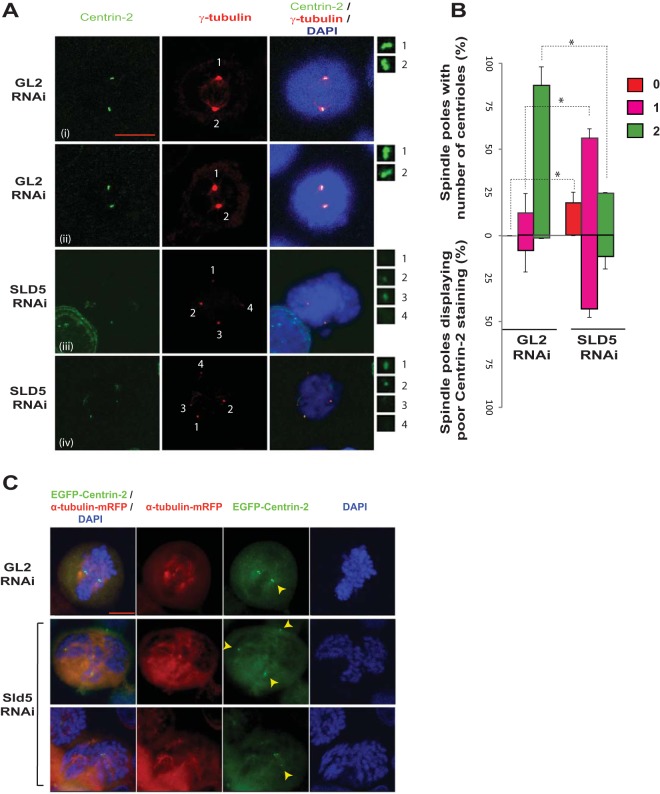
Sld5 depletion leads to centriole splitting and PCM fragmentation. (A) HeLa cells were transfected with control GL2 or SLD5 siRNA and costained for centrin-2 (green) and γ-tubulin (red) with specific antibodies, as well as for DNA with DAPI (blue). The centrosomes are numbered, and the insets show magnifications of the centrin-2 signal at the indicated poles. Note that in the control GL2 sample, one γ-tubulin spot coincides with a doublet of centrin-2 foci. Each centrin-2 focus marks one centriole and has been identified by staining with anti-centrin-2 antibody (i and ii). Examples of Sld5-depleted cells are shown in rows iii and iv. In rows iii and iv, centrosomes of mitotic cells (marked 1 to 4) show centrosome splitting and PCM fragmentation. (B) Quantification of the experiment shown in panel A. Spindle poles in GL2 or SLD5 siRNA-transfected samples were surveyed for the number of centrioles, as shown in the upper half of the bar graph. The lower half of the graph shows the percentages of monocentriolar and bicentriolar spindle poles that displayed low levels of centrin-2 staining in GL2 or SLD5 siRNA-transfected samples. The level of centrin-2 staining was surveyed at each monocentriolar and bicentriolar spindle pole to identify the poles with low levels of centrin-2 staining, which was confirmed by NIS Elements software for multiple examples to be less than 50% of the mean intensity of the signal observed in control cells. The data are represented as the means and SD of the results of two independent experiments, with more than 40 spindle poles analyzed in each sample (*, P < 0.05). (C) Centriole disengagement in HeLa cells stably coexpressing EGFP–centrin-2 and α-tubulin–m-RFP. Cells were transfected on three consecutive days with control GL2 or SLD5 siRNA, fixed, and imaged to capture EGFP, RFP, and DAPI signals. Centrioles, as identified by centrin-2 staining, are marked by arrowheads. Scale bar, 10 μm.

