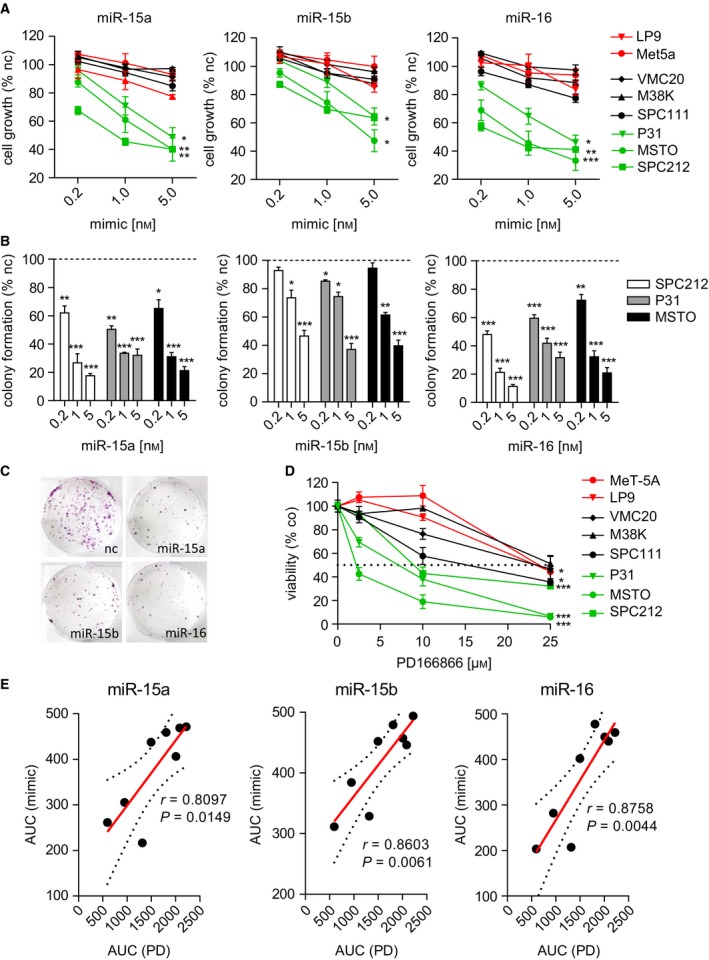
Figure 2.

Growth repression by microRNA mimics correlates with sensitivity to FGFR1 inhibition. (A) Growth inhibition determined by SYBR green staining 72 h after transfection with mimics compared with noncoding control (nc). (B) Quantification of colony formation assays of the three sensitive cell lines after transfection with mimics as indicated. (C) Representative colony formation pictures of MSTO cells transfected with 5 nm microRNA or control mimics as indicated. (D) Dose–response curves of MPM cell lines 72 h after treatment with PD166866 or DMSO (co), determined by MTT assay. (E) Growth inhibition shown as area under curve (AUC) of mimics (5 nm) in correlation (Pearson) effects of PD166866, calculated from MTT dose–response curves in E. Each dot represents one cell line. *P < 0.05, **P < 0.01, ***P < 0.001; otherwise, P > 0.05.
