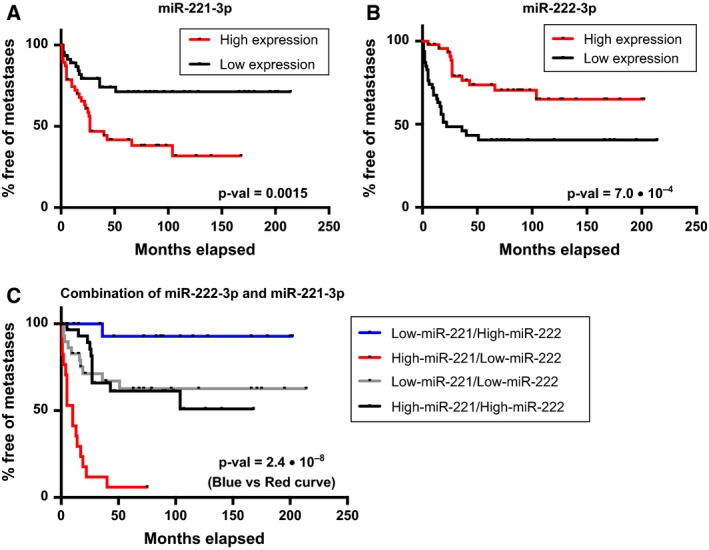
Figure 5.

The prognostic value of the expression of miR‐221‐3p and miR‐222‐3p in function of time to metastasis. (A) Kaplan–Meier analysis of time to metastasis when subdividing the OS samples into high/low expression groups for miR‐221‐3p (based on the median expression). (B) Kaplan–Meier analysis of time to metastasis when subdividing the OS samples into high/low expression groups for miR‐222‐3p (based on the median expression). (C) Kaplan–Meier analysis of time to metastasis when combining the expression of both miR‐221‐3p and miR‐222‐3p for each patient. The discovery cohort and validation cohort have been combined for all three analyses. The Kaplan–Meier analysis of the high/low expression groups for the individual analyses of miR‐221‐3p and miR‐222‐3p contained 47 OS samples in each group. For the combined analysis of miR‐221‐3p/miR‐222‐3p expression, the number of OS samples in each group was as follows: 29 OS samples in high‐miR‐221‐3p/high‐miR‐222‐3p; 30 OS samples in low‐miR‐221‐3p/low‐miR‐222‐3p; 17 OS samples in high‐miR‐221‐3p/low‐miR‐222‐3p; and 18 OS samples in low‐miR‐221‐3p/high‐miR‐222‐3p. Data for the individual cohorts are shown in Fig. S4.
