Fig. 2.
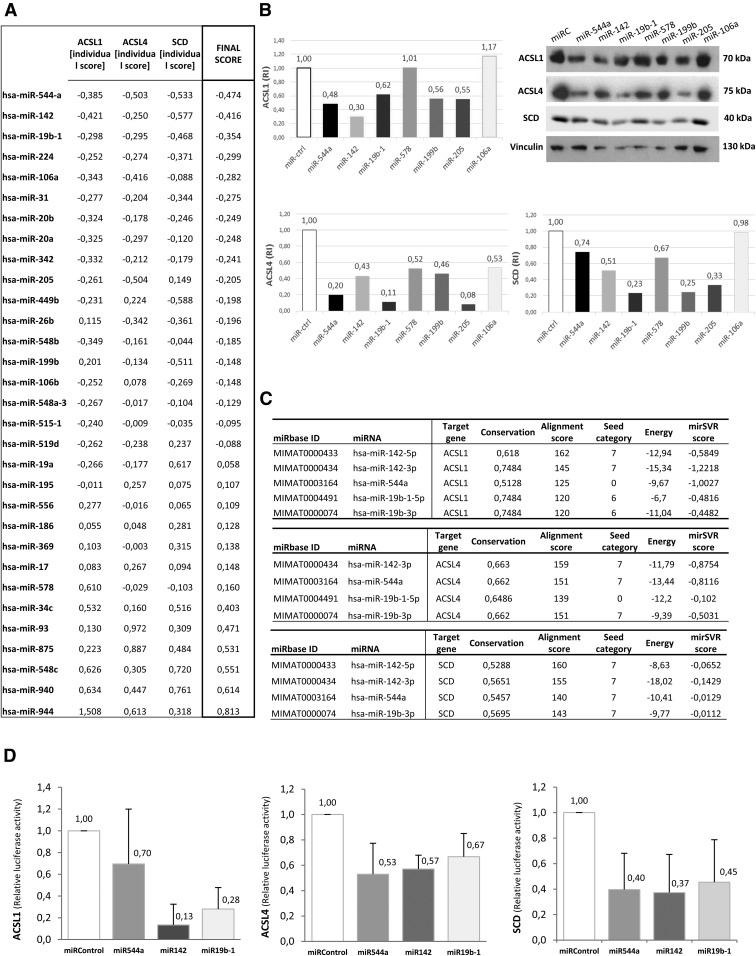
Validation of the predicted miRNAs shows evidence of three selected miRNAs: miR-142, miR-544a, and miR-19b-1. A: Interaction scoring method. ISs and FSs from miRNA-gene interactions upon performing RT-QPCR. The IS was obtained by subtracting the RT-QPCR replica’s mean (2−ΔΔCt) for each interaction from the global mean (2−ΔΔCt average among the 31 miRNAs for each gene). The FS represents the average of the three ISs. B: Western blotting showing ACSL1, ACSL4, and SCD protein depletion upon treatment with mimic miRNAs for selected candidates from previous RT-QPCR experiments: miR-578, miR-199-b, miR-205, miR-106a, miR-142, miR-544a, and miR-19b-1. A negative mimic miRNA control without any known target was used as a control. RI, the relative intensity of protein bands compared with controls. C: miRanda/mirSVR scoring schema of mRNA-miRNA interactions: ACSL1, ACSL4, and SCD and the selected miRNAs [miR-544a, miR-142 (miR-142-3p and miR-142-5p), and miR-19b-1 (miR-19b-1-5p and miR-19b-3p)], based on three different scores generated by miRanda (alignment, thermodynamic, and conservation scores) and the mirSVR machine learning-based score. D: The relative luciferase activity of ACSL1 (left graph), ACSL4 (middle graph), or SCD (right graph) 3′UTR psiCHECK™-2 vectors upon treatment with the selected miRNAs (miR-142, miR-544a, and miR-19b-1). The relative luciferase activity (Renilla luminescence/firefly luminescence) was determined 48 h after transfection, representing the translational repression of the proteins upon binding to the 3′UTR of candidate miRNAs. A miRNA with no predictive target was used as a negative control. Results represent the fold-change mean ± SD (n = 3).

