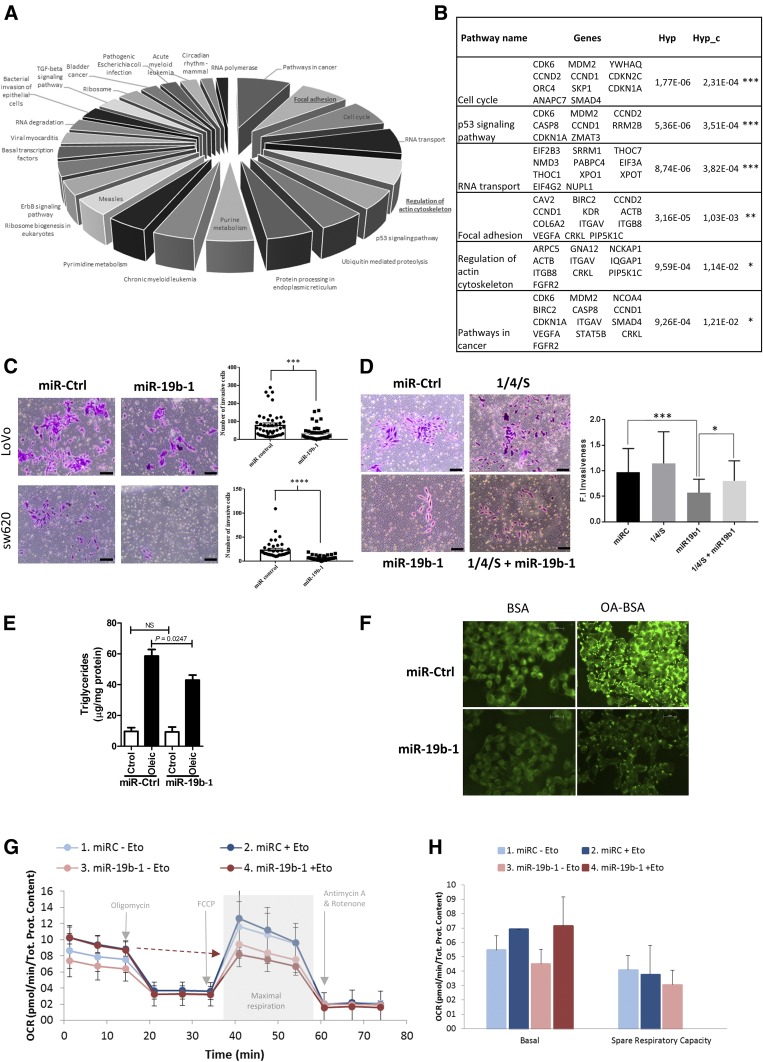
Fig. 4.
MiR-19b-1 implication in cell invasion and lipid metabolism. A: Biological processes elicited by miR-19b-1 obtained from GeneCodis 3 (29). The chart is ordered according to the increasing number of genes involved in each process (Hyp_c < 0.05). The Hyp_c the P value obtained from the hypergeometric test determined the significance of the biological process. For miRNA hsa-miR-19b-1, due to its promiscuity, targets were limited to the ones experimentally validated and were retrieved from the TarBase database. B: Genes involved in each biologically predicted process elicited by miR-19b-1 and ordered by Hyp_c C: Boyden chamber transwell assay of invasion through Matrigel. miR-19b-1 or a control miRNA with no predicting binding site in the 3′UTR of ACSL1, ACSL4, or SCD was electroporated into SW620 or LoVo cells. D: Boyden chamber transwell assay for invasion through Matrigel. As a rescue experiment, vectors expressing ACSL1, ACSL4, and SCD were transfected together with mimic miR-19b-1 (miR-19b-1) or a control miRNA (miR-Ctrl) in SW620 cells. The positive invasion controls, miR-Ctrl alone and (1/4/S), were also included. In both cases (C, D), after 72 h with chemoattractant (10% FBS), inserts were fixed and stained with crystal violet. Nonmigrated cells were removed using cotton swabs and images were captured using an Olympus CKX41 microscope (Olympus, Tokyo, Japan) with a 20× LCAch objective and registered using analysis getIT software (Olympus). Scale bars, 50 μm. Results represent the number of migrated cells found in six random microscope fields in two independent inserts in three independent experiments ± SEM (n = 3). *P < 0.05, **P < 0.01, ***P < 0.001, ****P < 0.0001. E: TG analysis content in DLD-1 cells transfected with mimic miR-19b-1 or a mimic miRNA control upon a 0.5 mM OA-BSA or FA-free BSA (vehicle control) input. Lipid content is expressed in micrograms of TG per milligram of protein in two independent experiments ± SEM (n = 2). *P < 0.05. F: Representative immunofluorescence images of the distribution of the fluorophore, BODIPY, in DLD-1 cells transfected with mimic miR-19b-1 or a mimic miRNA control, upon a 0.5 mM OA-BSA or FA-free BSA (vehicle control) input. Images were captured using a Leica DM IL microscope from a representative experiment, with a 40× Plan Fluotar objective and registered using Leica Application Suite (n = 2). G: Bioenergetic profile (OCR) of cells transfected with miR-19b-1 or a mimic miRNA control with or without the addition of etomoxir. Injection schema (oligomycin, FCCP, antimycin A/rotenone) and key parameters assayed (basal respiration, maximal respiration, and spare capacity) are also indicated. H: Basal respiration and spare respiratory capacity quantification of cells transfected with miR-19b-1 or a mimic miRNA control with or without the addition of etomoxir. Both results show a representative experiment of two independent experiments with at least six replicates per condition ± SEM (n = 2).

