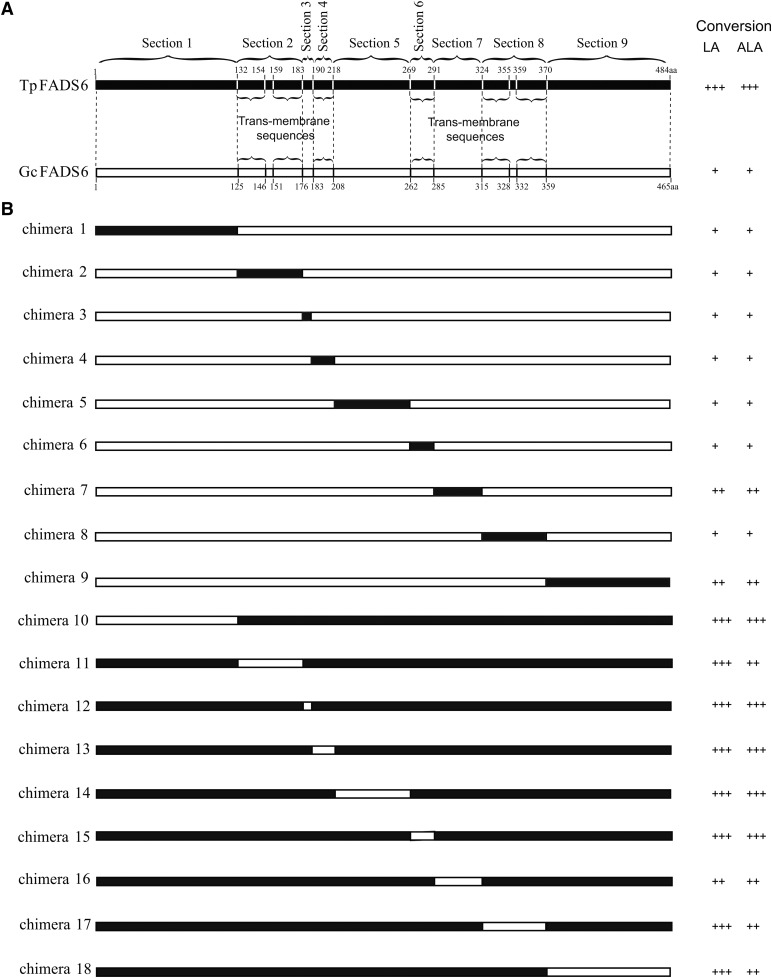
Fig. 1.
A: Skeleton map of the amino acid sequences of TpFADS2 (black bar) and GcFADS2 (white bar), which were divided into 9 sections shown by dotted lines. The braces indicate their trans-membrane sequences. B: Map of each FADS2 chimera constructed by reciprocal section swapping. Regions in black bars originated from TpFADS2 and regions in white bars originated from GcFADS2. Substrate conversion efficiency of each chimera was classified into three groups: +, <10%; ++, 11−25%; +++, >26%.

