Fig. 8.
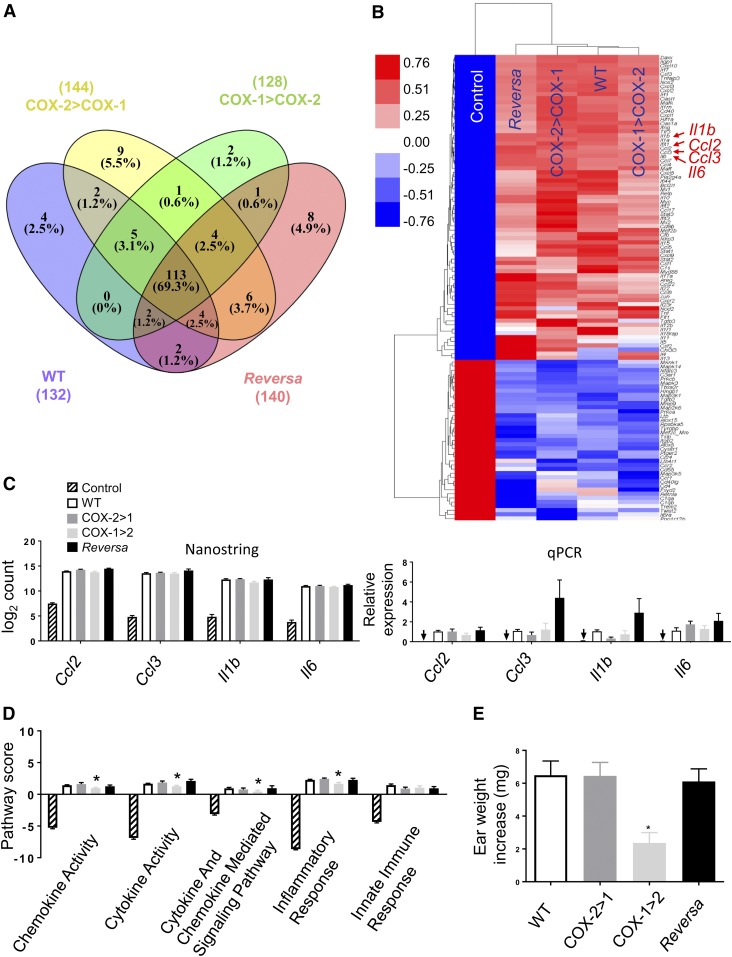
Differential gene expression and inflammatory signaling pathway of COX isoforms in macrophages. Peritoneal macrophages were harvested from mice either challenged in vivo with LPS (2 mg/kg, ip) or an equivalent volume of PBS (Control) for 6 h. A: Venn diagram showing the number of differentially expressed (fold change >2 vs. Control) genes induced by LPS in WT (132), in COX-2>COX-1 (144), in COX-1>COX-2 (128), and in Reversa (140) mice. Of the 248 genes represented in the array, 113 (69%) changed more than 2-fold in all four LPS-challenged genotypes of mice. B: Heat map of the results of hierarchical clustering analysis for the 113 genes. Each row represents a transcript and the column represents grouped and normalized signals for different treatments and different genotypes of mice (n = 6). Red and blue represent up- and down-regulation, respectively. C: Comparison of NanoString count analysis and qPCR-determined relative expression for Ccl2, Ccl3, Il1b, and Il6. Arrows indicate near absence of gene expression in Control mice detected under these conditions. D: nSolver 3.0-generated pathway score analysis for cytokine, chemokine, and associated inflammatory responses. Data are presented as mean ± SEM, n = 6 except for the qPCR data, n = 4. *P < 0.05 versus WT. E: Evaluation of ear inflammatory responses. Data are expressed as ear weight increase of an 8 mm diameter biopsy after AA treatment (left ear) compared with vehicle treatment (right ear). *P < 0.05 versus WT (n = 8).

