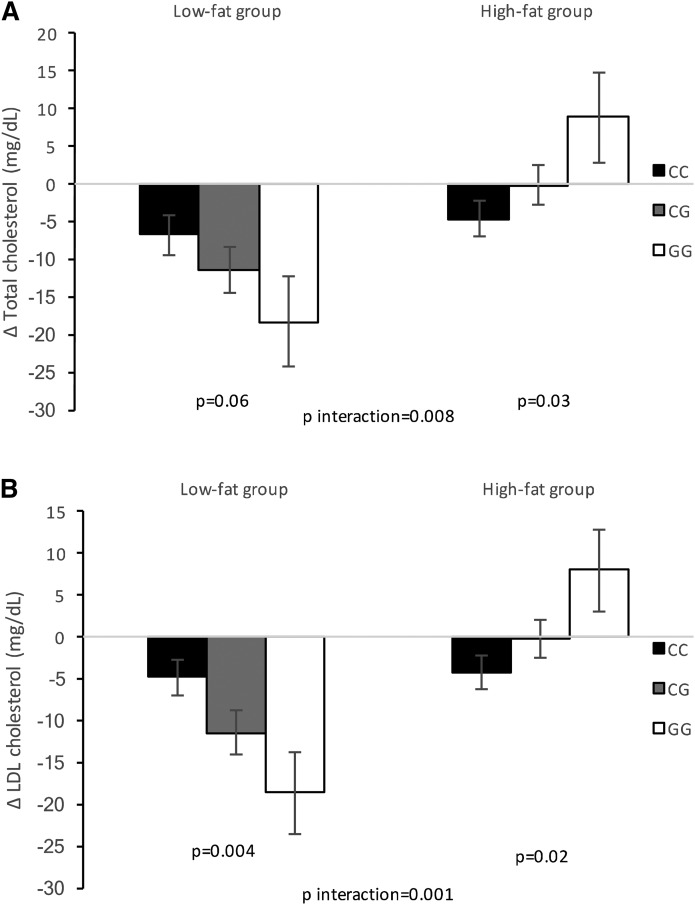
Fig. 1.
Interaction between the MTNR1B rs10830963 genetic variant and dietary fat intervention on changes in total cholesterol (A) and LDL cholesterol (B) at 2 years of diet intervention. Data are means (SE) after being adjusted for age, sex, ethnicity, BMI at baseline, the value for the respective outcome trait at baseline, lipid-lowering medication use, and body weight loss. Low-fat group sample sizes: CC n = 146, CG n = 97, and GG n = 27. High-fat group sample sizes: CC n = 137, CG n = 100, and GG n = 21.

