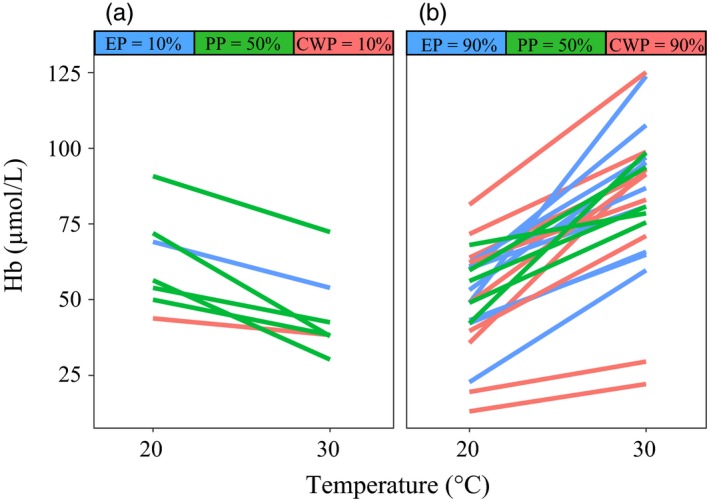
Figure 2.

Haemoglobin expression under hyper‐thermal stress. Reaction norms of haemoglobin (Hb) expression per genotype under hyper‐thermal stress (30°C) as compared to a nonstressful temperature regime (20°C). (a) Genotypes downregulating and (b) upregulating haemoglobin under hyper‐thermal stress as well as the percentage of genotypes changing expression in each resurrected subpopulation are shown. The reaction norms are colour‐coded as in Figure 1
