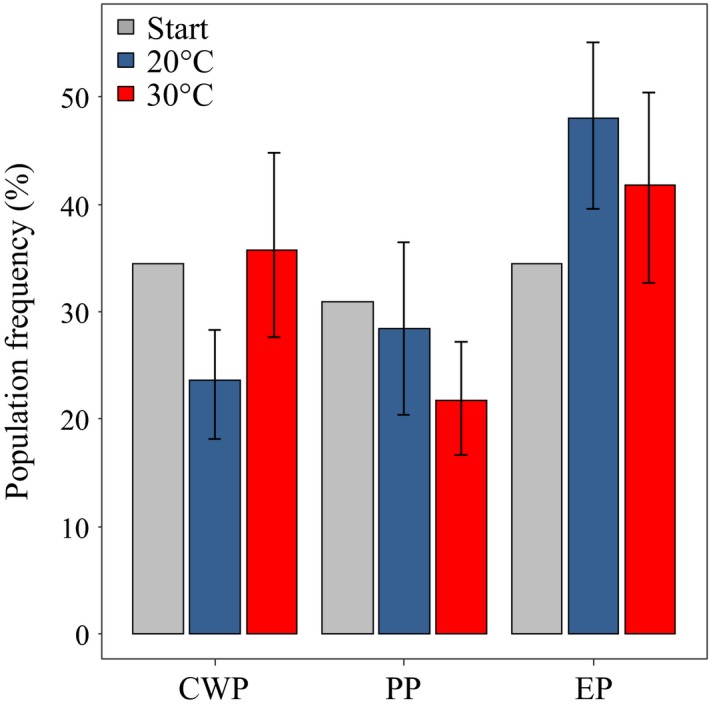
Figure 3.

Population frequency after selection in mesocosm experiments. Changes in subpopulation frequency are shown after 4 weeks of selection at 20°C (blue bars) and 30°C (red bars) as compared to an initial inoculum (start) of equal frequency of the three subpopulations. Variance among replicate mesocosms is shown for the temperature regimes. The staring inoculum had no variance as all mesocosms are inoculated with equal number of genotypes. Population codes are as in Figure 1
