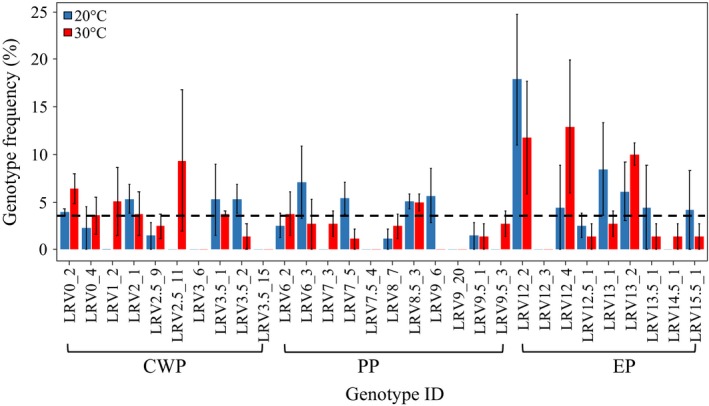
Figure 4.

Genotype frequency in the mesocosm competition experiment. Genotype frequencies, with variance among replicate mesocosms, are shown after 4 weeks at 20°C (blue bars) and 30°C (red bars) as compared to an initial equal frequency of genotypes (dotted line). Names on the x‐axis are the inoculated genotypes ID, grouped per subpopulation
