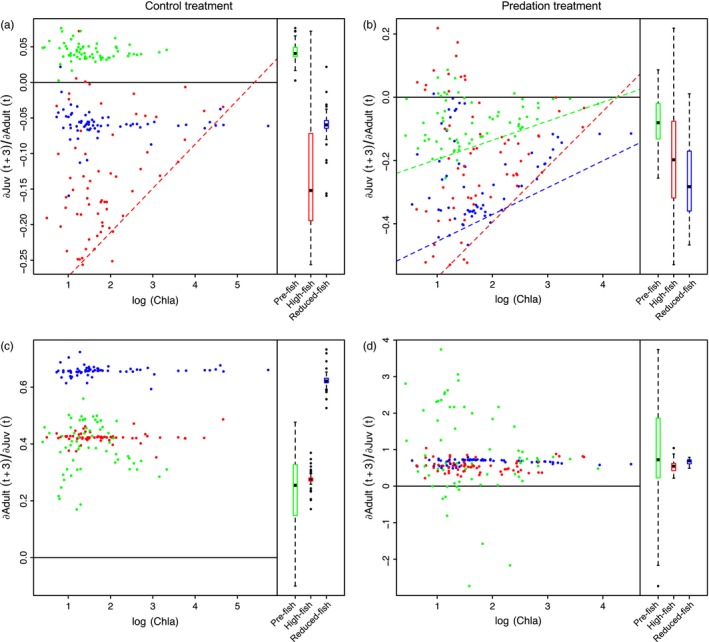
Figure 3.

The effect of Daphnia adults on Daphnia juveniles [∂Juv(t + 3)/∂Adult(t)] (a,b) and the effect of juveniles on adults [∂Juv(t + 3)/∂Adult(t)] (c,d) as a function of phytoplankton biomass (log(Chla)) for each population separately ( Pre‐fish,
  High‐fish, and
  Reduced‐fish) in the absence (a,c) and presence (b,d) of predation. Simple linear regressions (dashed lines) show significant (p < .005, see text) 0.05 quantile regressions between estimated interaction strengths and the log(Chla) for each population. Boxplots show the distribution of estimated interaction strengths for the three populations. The bottom and top of the box show the lower and upper quartiles, the band in between them shows the median; whiskers show the minimum and maximum (excluding outliers), and circles show the outliers. Outliers are values more than 1.5 times the length of interquartile range larger than the upper quartile or smaller than the lower quartile. The S‐map estimated interaction strengths are in normalized units. The solid line shows the line of no effect
