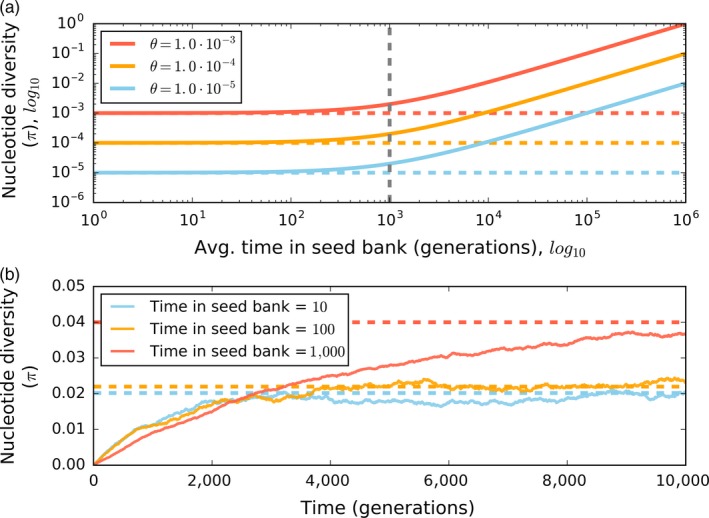
Figure 3.

(a) The expected level of nucleotide diversity (E[π]) for a sample of active individuals increases with the number of generations that an individual on average spends in the seed bank for a population at mutation–drift equilibrium with a given population‐scaled mutation rate (θ = 2Nμ). Here, N is the number of active individuals, M is the number of dormant individuals, and μ is the mutation rate for active individuals, where diversity is estimated as (Blath et al., 2015; equation 21). The average number of generations that an individual spends in the seed bank can be modeled as a geometric distribution, where the probability of exiting the seed bank each generation is and c is the number of individuals that exit the seed bank each generation (Blath et al., 2015, 2016). The vertical gray dashed line represents the point where the average number of generations that an individual spends in the seed bank is greater than the number of active individuals in the populations (i.e., the strong seed‐bank threshold). Vertical lines represent E [π] for a population without a seed bank in mutation–drift equilibrium. (b) The length of time required to reach mutation–drift equilibrium increases with the average number of generations that an individual spends in the seed bank. These results are from a simulated population evolving over time that is subject only to mutation and drift with a constant seed bank size. In both (a) and (b), we assume that dormant individuals do not acquire mutations. See Supplementary Information for more detail on implementation of model
