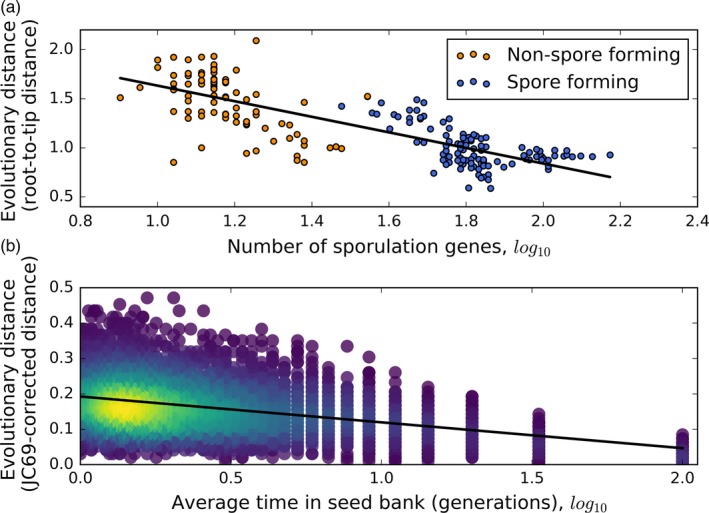
Figure 5.

(a) The evolutionary distance (calculated as the root‐to‐tip sum on the branch of the phylogeny) declines as the number of sporulation‐associated genes increases among Firmicutes taxa, a common group of bacteria found in soils and hosts. The publically available data presented here are from the Firmicutes phylogeny of conserved genes (Weller & Wu, 2015). (b) The evolutionary distance (calculated as the JC69 corrected distance) decreases as the average length of time that an individual spends in the seed bank increases (see Supplementary Materials). The lines in both (a) and (b) are the slopes from simple linear regression
