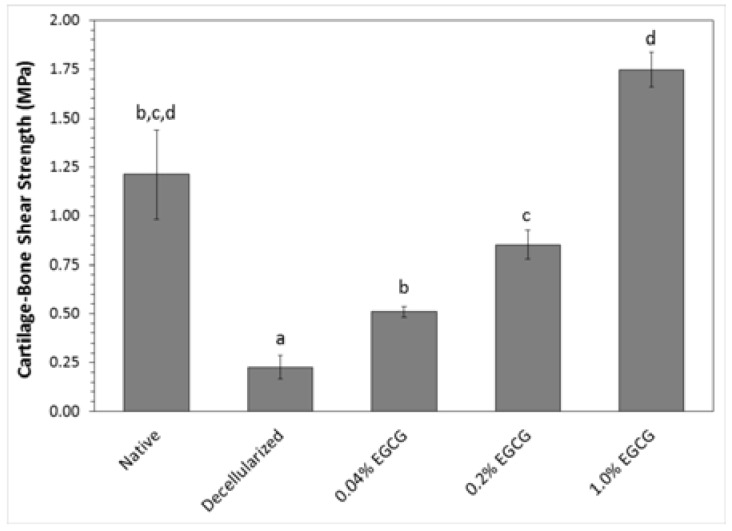
Figure 5.
Effect of EGCG concentration on strength of the cartilage-bone interface in shear (mean ± standard deviation). Letters indicate statistically homogeneous groups determined by ANOVA and Games-Howell post hoc test; Native vs. Decellularized p = 0.043, Native vs. 0.04% EGCG p = 0.099, Native vs. 0.2% EGCG p = 0.310, Native vs. 1% EGCG p = 0.142, Decellularized vs. 0.04% EGCG p = 0.025, Decellularized vs. 0.2% EGCG p = 0.002, Decellularized vs. 1% EGCG p = 2.05 × 10⁻⁴, 0.04% EGCG vs. 0.2% EGCG p = 0.034, 0.04% EGCG vs. 1% EGCG p = 0.003, and 0.2% EGCG vs. 1% EGCG p = 0.001.

