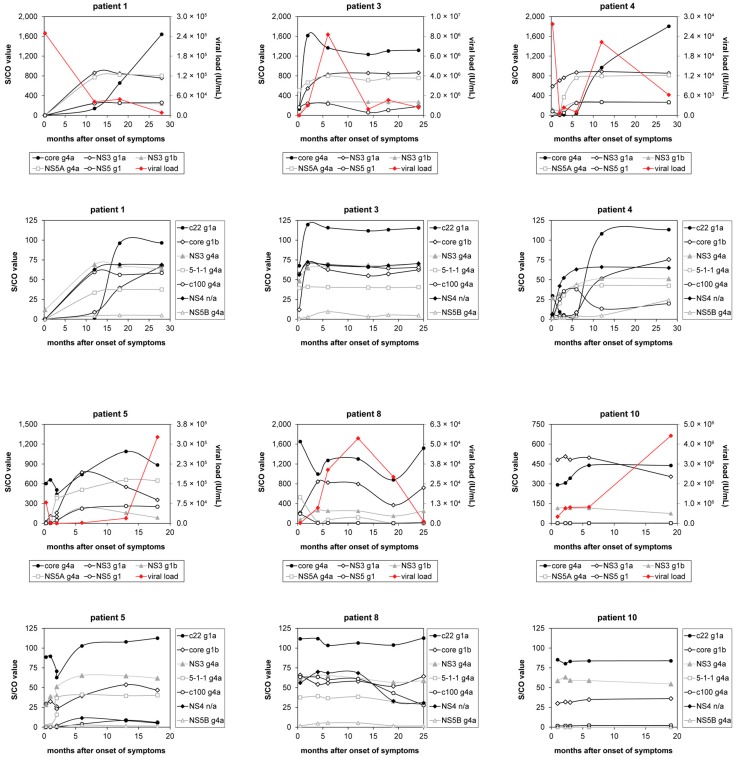
Figure 2.
Time courses of antibody reactivity and viral load from acute to chronic HCV infection. Antibody reactivity is depicted for six exemplary patients from the data set, who developed a chronic HCV infection shown in Figure A1. For every patient two graphs were generated of which the first shows the reactivity towards five HCV antigens and the viral load. The second graph shows the reactivity towards the other seven HCV antigens.

