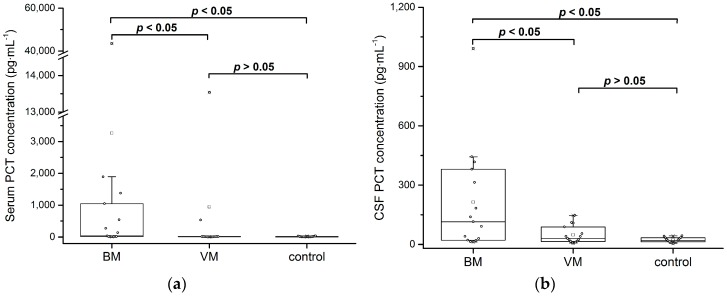
Figure 4.
Comparison of PCT levels between patients with bacterial meningitis (BM), viral meningitis (VM), and control patients. PCT concentration was above the Simoa PCT assay LLoQ in all 90 measured samples. (a) PCT concentration in human serum. Statistically significant difference between the BM group and the VM and control groups (two-sided Mann–Whitney U test: p < 0.05). No statistically significant difference between the VM and control groups (two-sided Mann–Whitney U test: p > 0.05). (b) PCT concentration in human cerebrospinal fluid (CSF). Statistically significant difference between the BM group and the VM and control groups (two-sided Mann–Whitney U test: p < 0.05). No statistically significant difference between the VM and control groups (two-sided Mann–Whitney U test: p > 0.05).

