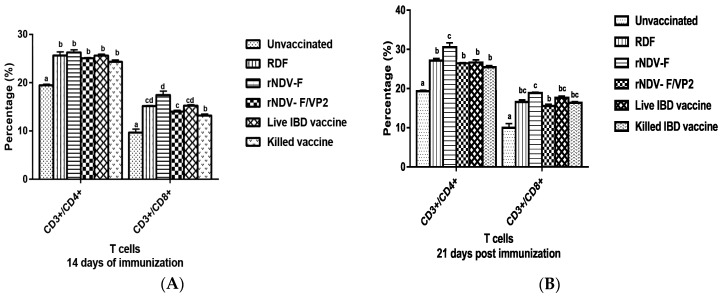
Figure 7.
Flow cytometric analysis of CD4+ and CD8+ T cells in peripheral blood mono-nuclear cells (PBMCs) of vaccinated and unvaccinated birds at 14 (A) and 21 (B) dpi. PBMCs were collected from the birds and 1 × 10⁵ cells were analyzed after addition of chicken specific Mabs conjugated with fluorescent dyes. Data represent the percentage of cells ± SEM. The values depicted in different lowercase superscripts differ significantly (p < 0.01) and Waller-Duncan as post-hoc test.

