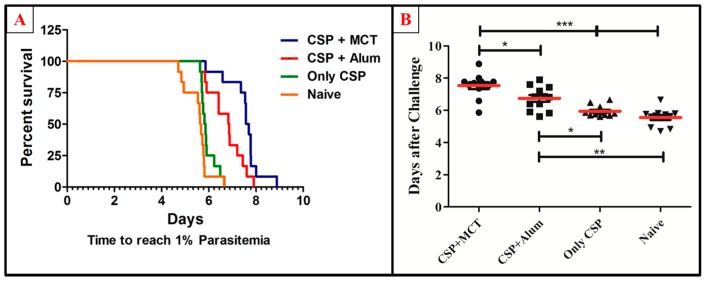
Figure 6.
Survival curve and comparative analysis of challenge with P. berghei expressing CSP of P. vivax. Mice were immunized as described in Figure 3 and challenged on day 42. (A) Kaplan Meyer curve for the time until mice have more than 1% of the erythrocytes infected. (B) Number of days until mice have more than 1% of erythrocytes infected. MCT + CSP induced significantly better protection than the group vaccinated with CSP formulated in Alum (p = 0.0148). Moreover, CSP formulated in MCT induced highly significant protection compared to control mice(p = 0.0001). The data represent pooled results of 2 independent experiments (6 mice per group in each experiment), and were analyzed using GraphPad Prism software applied to assess the means of groups by Tukey’s Multiple Comparison Test of one-way ANOVA. *** p value < 0.0001; ** p value < 0.001; * p value < 0.01.

