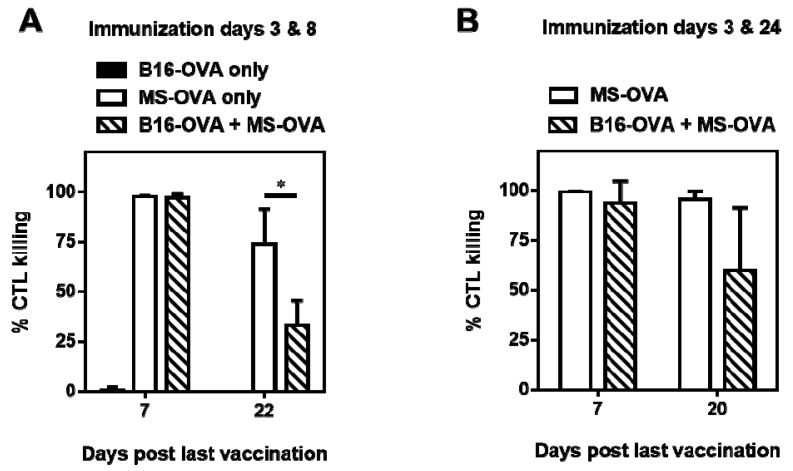
Figure 3.
In vivo cytotoxicity assay during immunotherapy with MS-OVA. Naïve C57BL/6 mice were given 106 B16-OVA tumor cells s.c. on day 0 in the dorsal flank. A total of 20 μg MS-OVA was administered s.c. at the base of the tail away from the tumor site. At 1 week or 3 weeks post boost, CFSE-stained target splenocytes were injected intravenously (i.v.); 24 h later recipient spleens were removed and processed to measure in vivo cytolytic killing. The different vaccination timings on day 3 and 8 (A), or 3 and 24 (B) were carried out in two separate experiments. The graphs show in vivo cytolytic killing for individual animals and the group mean ± SD (n = 3–5/timepoint/group) at 1 week and 3 weeks post boost. Mean ± SD, n = 3–5/timepoint/group. * p = 0.0308 Unpaired two-tailed t test was performed with GraphPad Prism software.

