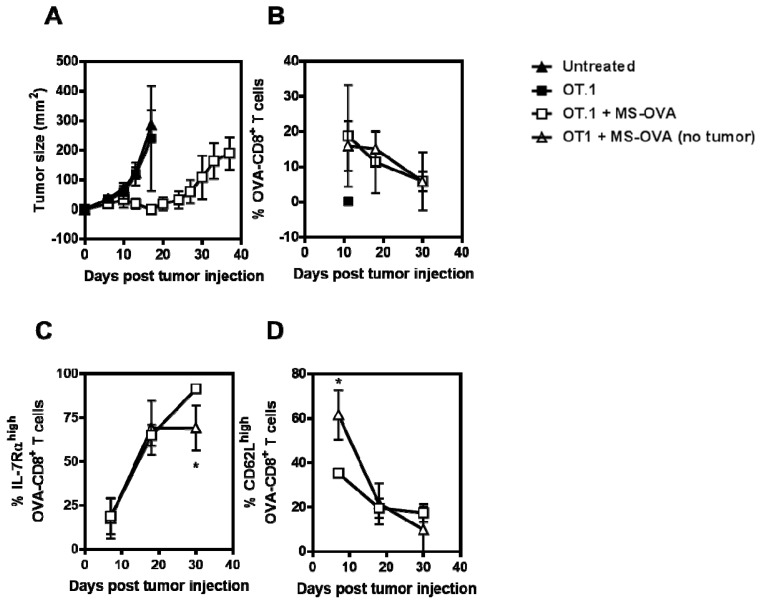
Figure 4.
Frequency and phenotype of responding OVA257-264-specific CD8+ T cells. C57BL/6 mice were given 106 B16-OVA tumor cells s.c. in the dorsal flank. Two days later, 105 OT.1 splenocytes were given intravenously. On days 3 and 8 after tumor injection, 20 μg MS-OVA was injected s.c. at the base of the tail away from the tumor site. (A) Tumor growth was measured over time. At varying time points blood was collected for FACS analysis of (B) OVA-CD8+ T cells, and their expression of (C) CD62L and (D) IL-7Rα. Mean ± SD, n = 5. Unpaired two-tailed t test with Welch’s correction for unequal variance (C) * p < 0.05 (D) * p < 0.05.

