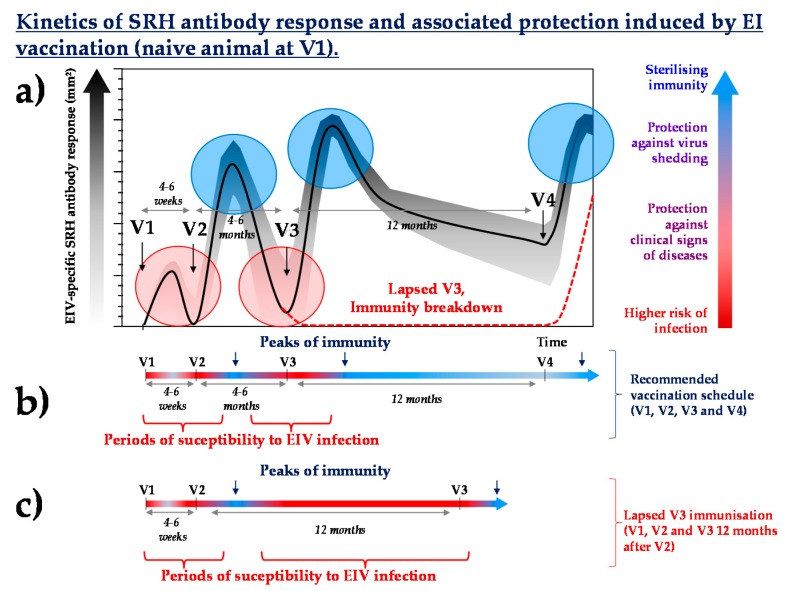
Figure 3.
Kinetics schematic of the EIV-specific antibody response (a) induced by recommended vaccination schedules (b) ([29,30,31,32,33,34,35,36,37]) and potential impact of lapsed V3 immunisation (c). Blue circles represent usual peaks of immunity, red circles show usual periods of susceptibility to EIV infection. SRH = single radial haemolysis.

