Figure 2.
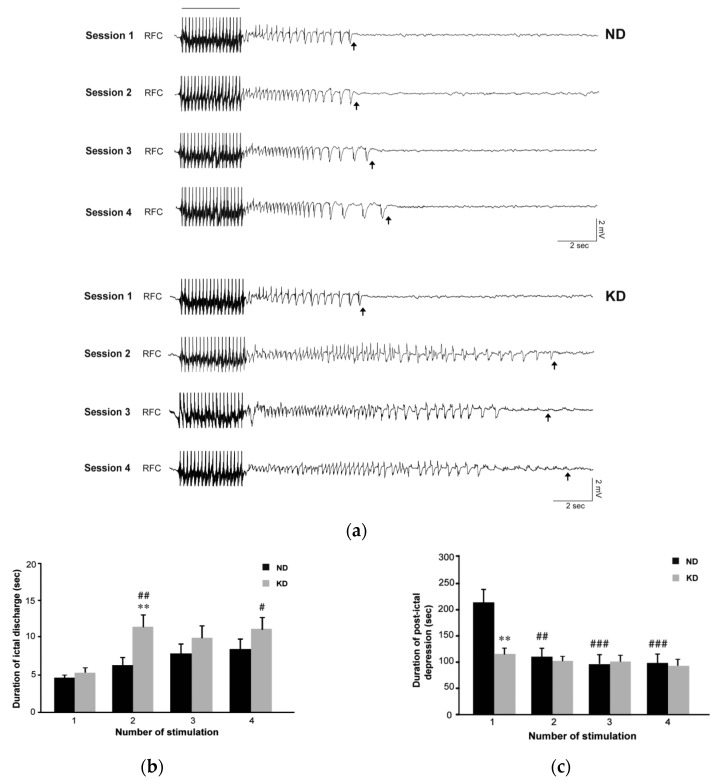
Video electrocorticographic (ECoG) recordings in mice fed the ketogenic diet (KD) and repeatedly tested in the 6-Hz corneal stimulation model. (a) ECoG traces illustrating the response detected in the presence of the normal diet (ND) or the KD, during and after a corneal stimulation of one representative mouse after repeated electrostimulations. The black bar indicates a stimulus artifact. Black arrows indicate the end of the ictal discharge. Note that the epileptiform activity changed in terms of duration and waveform when comparing session 1 with session 2. (b) Histograms illustrating the mean duration of ictal discharges recorded in session 1 and 2 in ND (n = 9) and KD (n = 9) groups. The duration of ictal discharges significantly increased in KD mice at the second session of stimulation (## p < 0.01 for session 2 vs. session 1; Holm–Šídák test). Moreover, these values were significantly higher than in ND mice when considering session 2 (** p < 0.01). Interestingly, a longer ictal activity was observed in the KD group in the subsequent sessions of seizure induction. In particular, a statistical difference was found by comparing session 4 to session 1 in the same animals (# p < 0.05; Holm–Šídák test). (c) Histograms illustrating the mean duration of post-ictal depression as measured in the various sessions of 6-Hz corneal stimulation. The duration of post-ictal depression was significantly reduced in the ND group at the second session of stimulation (## p < 0.01, sessions 2 vs. session 1). Note also that at the first session, post-ictal depression was shorter in KD mice compared to ND mice (** p < 0.01). RFC denotes right frontal cortex (epidural electrode). Statistical significance values are indicated as #: p < 0.05, **: p < 0.01, ##: p < 0.01, ###: p < 0.001.

