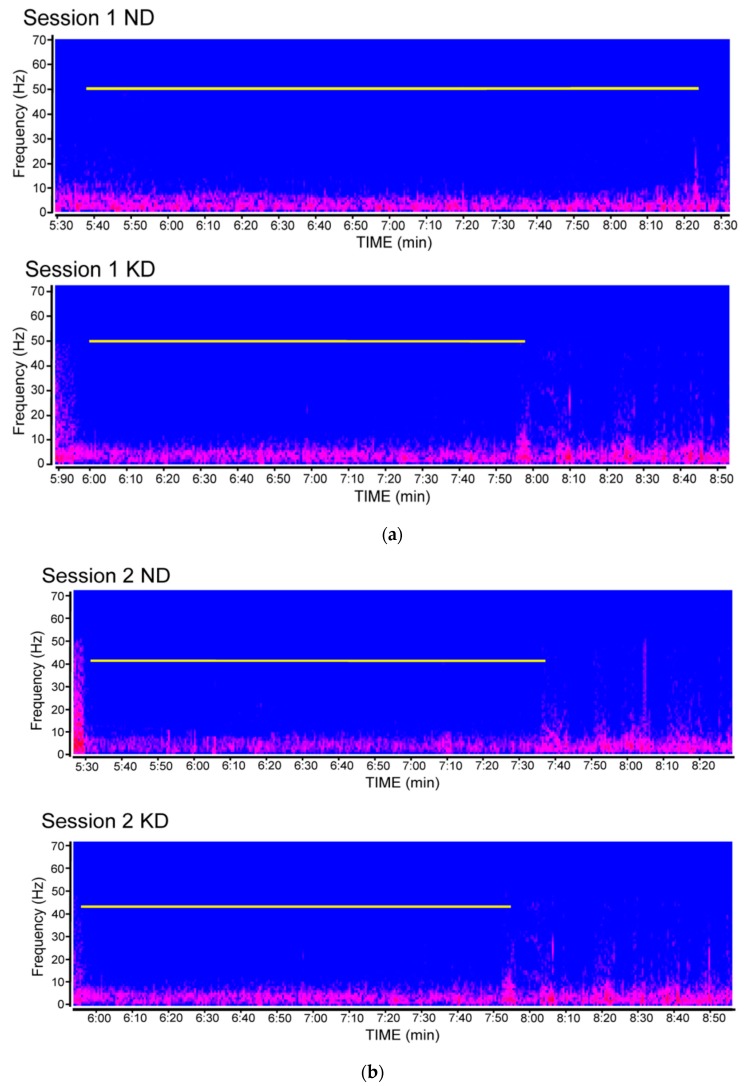
Figure 3.
Compressed spectral array showing the duration of post-ictal depression in video electrocorticographic (ECoG) recordings obtained from mice fed the ketogenic diet (KD) or a normal diet (ND) and repeatedly tested in the 6-Hz corneal stimulation model. (a) ECoG traces illustrating the response detected in the first session of seizure induction. The white line indicates the duration of post-ictal depression. In (b), ECoG traces from mice stimulated in the second session of seizure induction. Spectral arrays were from different mice of each respective experimental group. Note that the difference observed in the first session is no longer detectable in the second session of 6-Hz corneal stimulation.

