
Table 3.
Cytotoxic effects of 3a–l against MCF-7 and HeLa cell lines. The results are presented as LC50 (μM) ± standard deviation (SD) from three individual experiments.
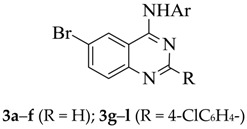
| Compound | R | Ar | LC50 (μM) ± SD | |
|---|---|---|---|---|
| MCF-7 | HeLa | |||
| 3a | H | 2-FC6H4- | 1.60 ± 0.07 | 7.78 ±0.11 |
| 3b | H | 3-FC6H4- | 2.67 ± 0.88 | 3.95 ± 0.44 |
| 3c | H | 4-FC6H4- | 3.52 ± 0.78 | 3.24 ± 0.18 |
| 3d | H | 3-ClC6H4- | 4.26 ± 1.45 | 6.99 ± 0.14 |
| 3e | H | 4-BrC6H4- | 8.85 ± 1.22 | 11.05 ± 2.38 |
| 3f | H | 2,4-diFC6H3- | 1.54 ± 0.59 | 5.68 ± 1.04 |
| 3g | 4-ClC6H4- | 2-FC6H4- | 0.14 ± 0.02 | 0.57 ± 0.11 |
| 3h | 4-ClC6H4- | 3-FC6H4- | 0.73 ± 0.66 | 1.45 ± 0.39 |
| 3i | 4-ClC6H4- | 4-FC6H4- | 1.44 ± 0.41 | 4.97 ± 0.03 |
| 3j | 4-ClC6H4- | 3-ClC6H4- | 0.99 ± 0.18 | 2.77 ± 0.15 |
| 3k | 4-ClC6H4- | 4-BrC6H4- | 2.03 ± 0.03 | 3.76 ± 0.62 |
| 3l | 4-ClC6H4- | 2,4-diFC6H3- | 0.14 ± 0.04 | 0.18 ± 0.02 |
| Gefitinib | 0.51 ± 0.11 | 2.37± 1.21 | ||