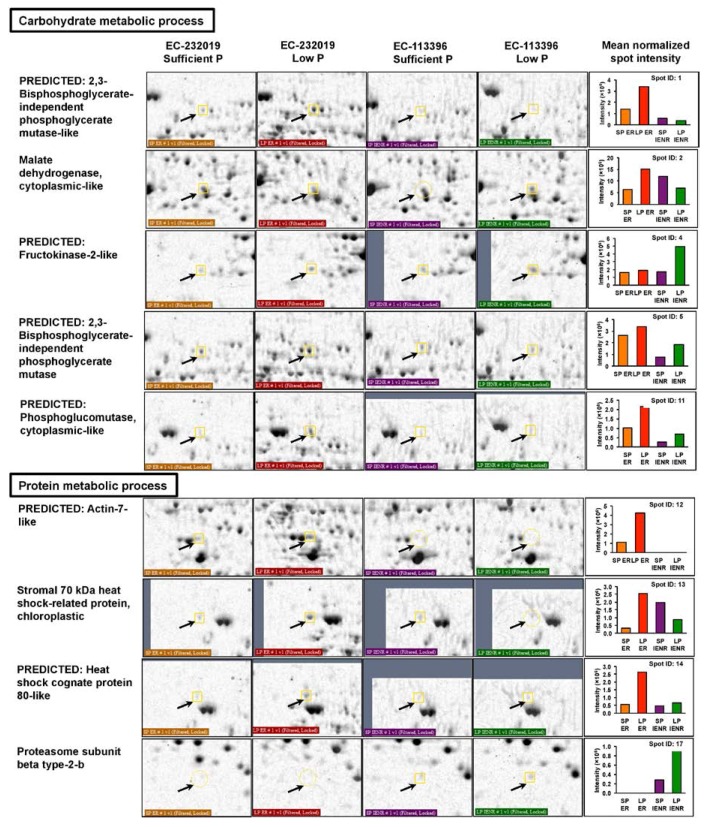
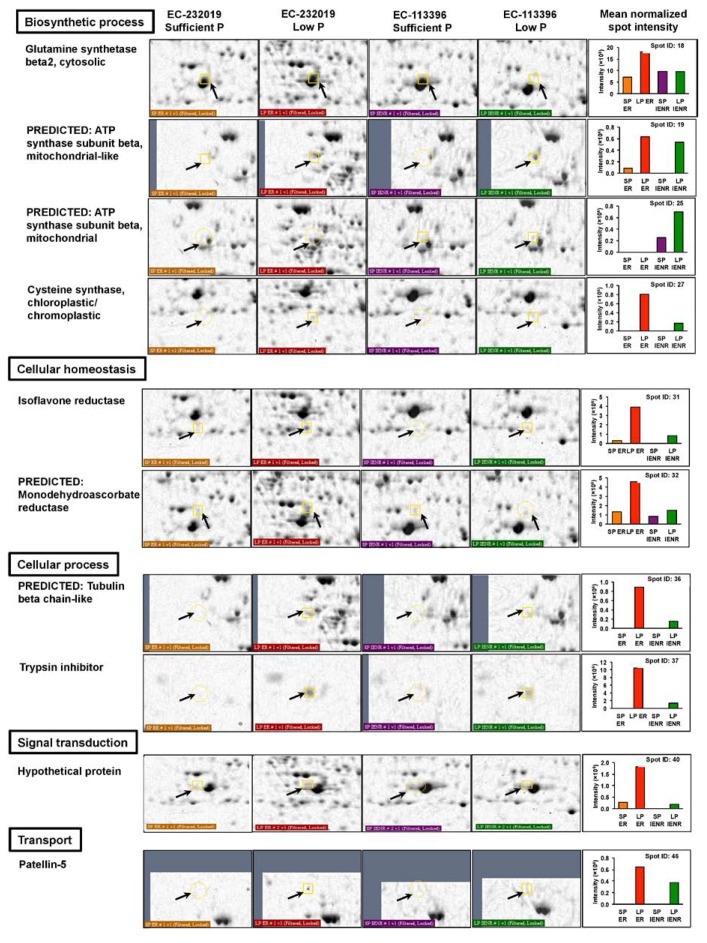
Figure 4.
Root proteins increased by more than two-fold at low (4 μM) P in contrasting soybean genotypes. Arrows denote the protein spots zoomed for better visualization. Bars in the graph denote the mean (n = 3) normalized intensity of protein spots on gels of EC-232019 Sufficient P (orange, SP ER), EC-232019 Low P (red, LP ER), EC-113396 Sufficient P (violet, SP IENR) and EC-113396 Low P (green, LP IENR). Proteins with significant Mascot score are presented here. Refer Table 1 for entire list of increased proteins.


