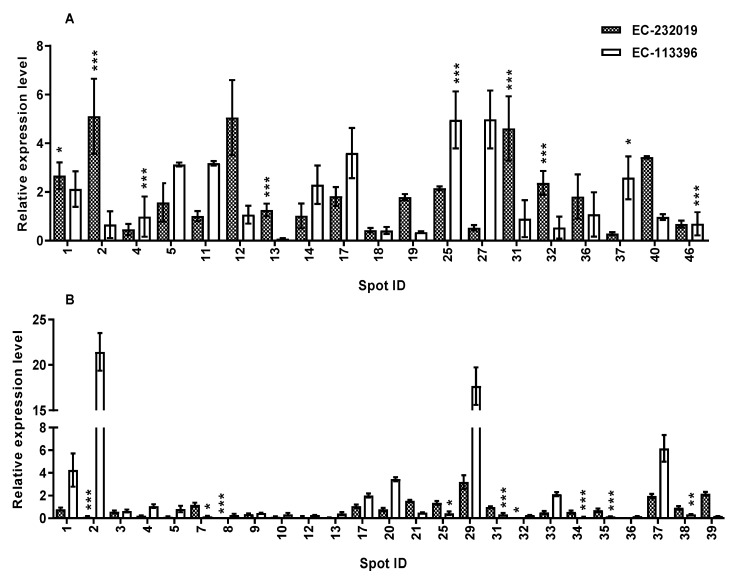
Figure 6.
Relative transcript levels of genes encoding differentially abundant proteins (A) up-regulated and (B) down-regulated by more than two-fold at low (4 μM) P in soybean roots. Data correspond to mean±SE (n = 9). Spot ID corresponds to the protein spots in Supplemental Figure S3B,D. *, ** and *** denote significance at 0.05, 0.01 and 0.001 probability levels, respectively.

