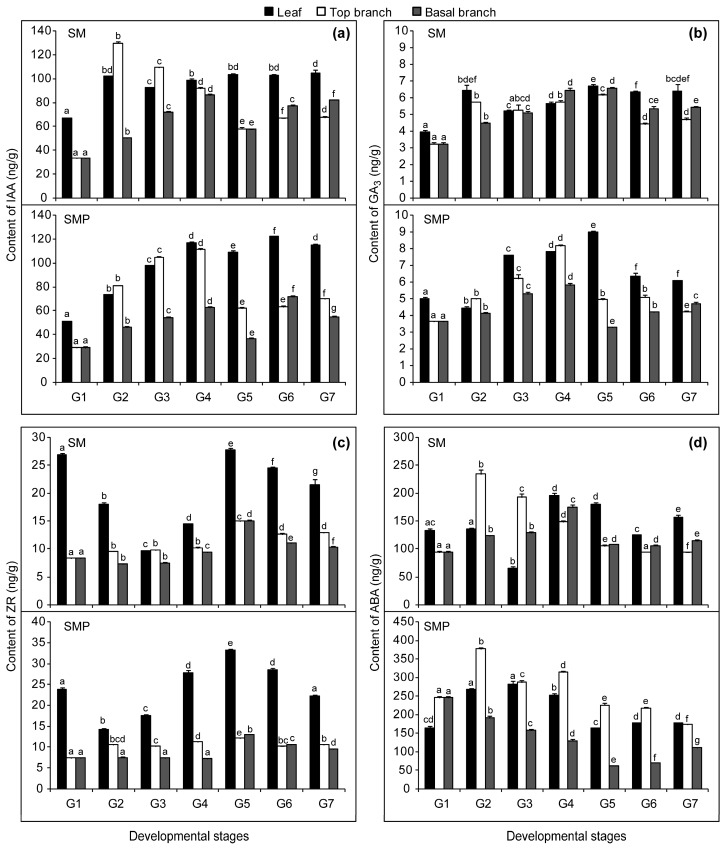
Figure 2.
Changes in endogenous hormone content during different developmental stages and in tissues: (a) indole acetic acid (IAA); (b) gibberellic acid (GA3); (c) zeatin riboside (ZR) and (d) abscisic acid (ABA). Leaf, top branch, and basal branch represent the three tissues, and G1-G7 represent the seven developmental stages. SM, S. matsudana; SMP, S. matsudana var. pseudo-matsudana. Hormone concentrations in fresh weight. Bars represent SE (n = 9). Different letters on columns with the same pattern indicate differences at P<0.05 according to the LSD test.

