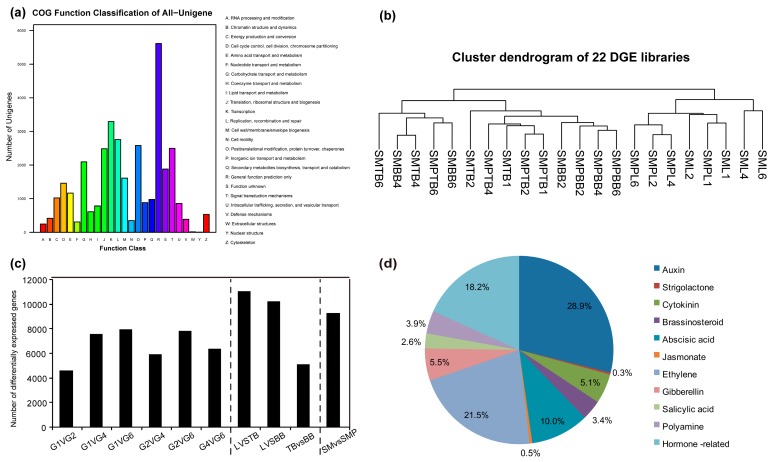
Figure 3.
Global characterization of gene expression patterns among three tissues at four developmental stages. (a) Cluster of Orthologous Group (COG) classification of unigenes. A total of 17, 013 unigenes were assigned to the COG database. The horizontal axis is the 26 COG categories and the vertical axis is the number of unigenes in each category. (b) Cluster dendrogram showing relationships of gene expression in different tissues and species at four developmental stages. Branch length indicates degree of variance; sample names defined in Table 1. (c) Histogram analyses of differentially expressed genes between developmental stages and tissues. L, leaf; TB, top branch; BB, basal branch; SM, S. matsudana; SMP, S. matsudana var. pseudo-matsudana. (d) Classification of identified genes based on hormones.

