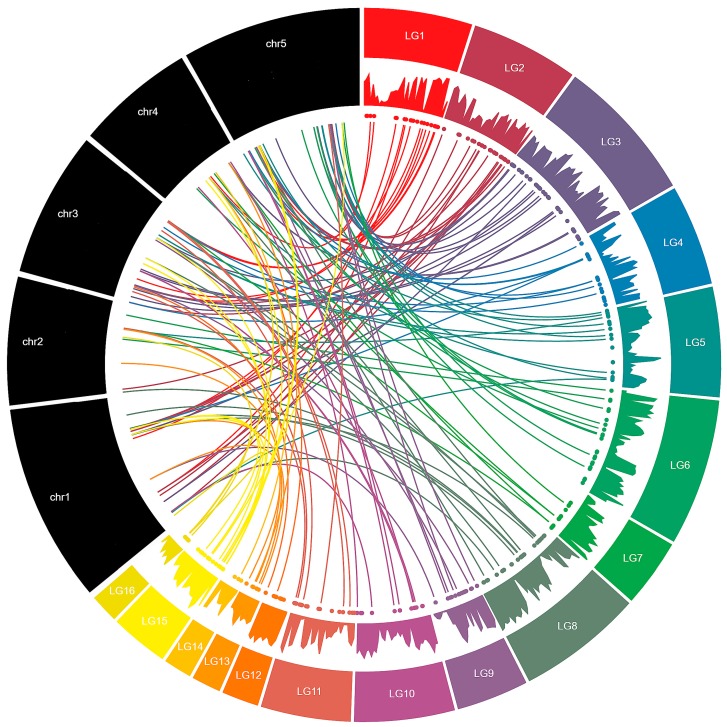
Figure 3.
Syntenic relationships between MYB genes in sesame and Arabidopsis genomes. The black bars represent the chromosomes of Arabidopsis whereas the colored bars represent the linkage groups of the sesame genome. The numbers LG01–16 represent linkage groups within the sesame genome and the five Arabidopsis chromosomes are labeled Chr1–Chr5. The area chart displays the gene density along the LGs in the sesame genome. The colored dots represent the locations of the SIMYB genes along the LGs. Colored lines indicate orthologous genes in sesame and Arabidopsis.

