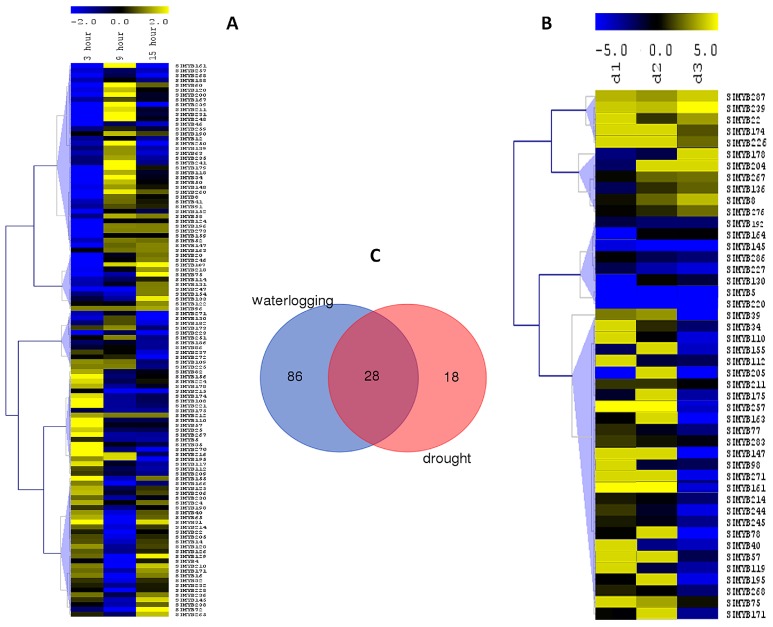
Figure 5.
Transcriptome profiling of MYB gene expression under waterlogging and drought stress. (A) Heatmap displaying expression changes of differentially expressed MYB genes in sesame plants stressed for 3 h, 9 h and 15 h of waterlogging compared with the control; (B) Heatmap displaying expression changes of differentially expressed MYB genes in sesame plants stressed for 3 days (d1), 7 days (d2), and 11 days (d3) of drought compared with the control; and, (C) Venn diagram depicting the shared and stress-specific differentially expressed genes between waterlogging and drought.

