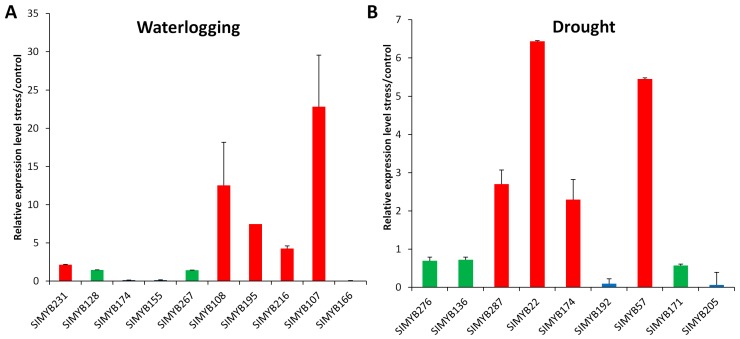
Figure 6.
MYB gene induction rates in sesame roots during abiotic stress treatments. (A) 9 h of waterlogging; (B) 3 days of drought. Transcripts abundance was quantified through qRT-PCR and the experimental values were normalized using sesame Actin as reference gene. The histograms represent the relative expression values of induction rates (stress/control). The green bars represent the no significantly regulated genes, the red bars represent the genes significantly up-regulated (induction rate > 2) and the blue bars represent the significantly down-regulated genes (induction rate < 2).

