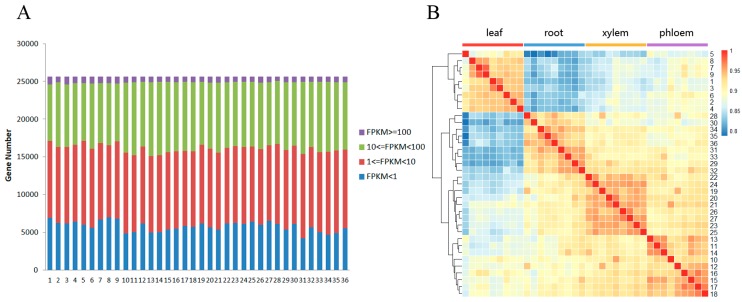
Figure 1.
Effect of salt stress on the Populus euphratica transcriptome. (A) Number of genes expressed in the treated samples. (B) Cluster heat map showing the global relationships of the expressed genes between samples. The heat map was made using the default settings and cor and hclust functions in R. 1-36 stand for the 12 samples with three repeats sequenced for leaf, phloem, xylem and root. FPKM: Fragments Per Kilo-base of gene per Million mapped fragments.

