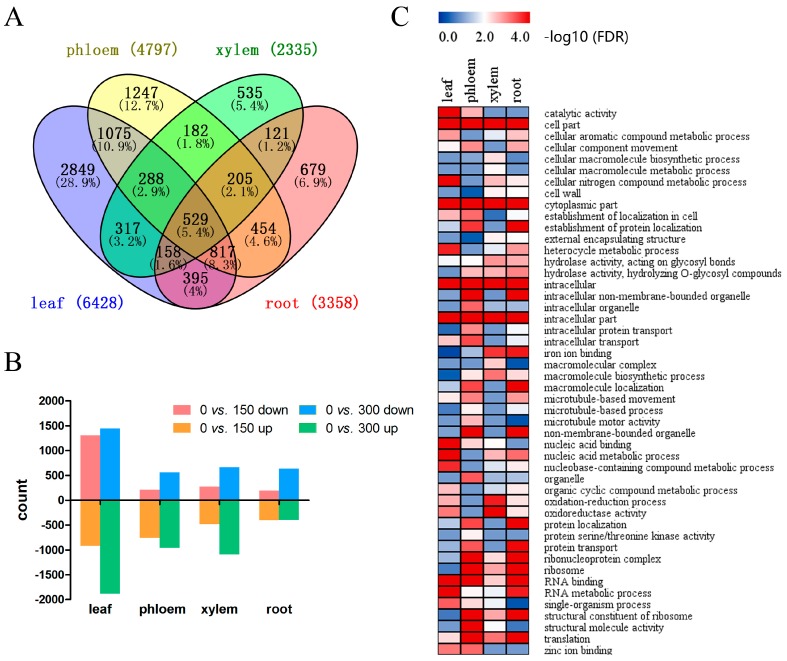
Figure 2.
(A) Venn diagram showing the unique and shared DEGs between the transcriptomes from the treated and control P. euphratica samples; (B) Up-regulated and down-regulated differentially expressed genes (DEGs) from the 0 vs. 150 mM and 0 vs. 300 mM comparisons in four tissues; (C) Gene ontology (GO) enrichment heat map for all the DEGs within the different tissues. FDR: false discovery rate.

