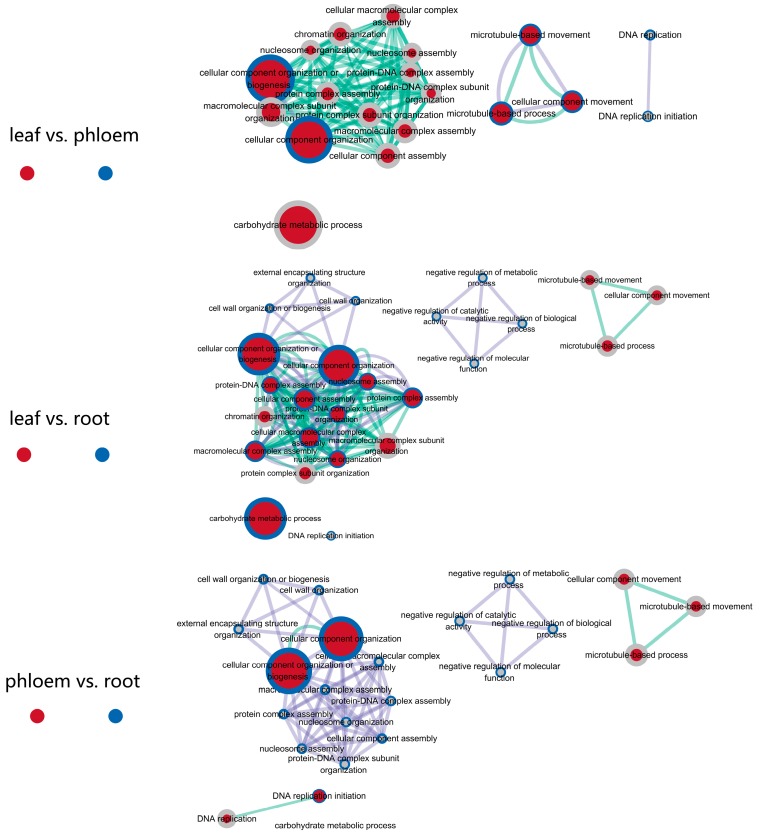
Figure 3.
Network analyses for the DEGs with similar expression patterns in P. euphratica leaf, phloem, xylem and root tissues. GO modules for the biological processes were visualized using EnrichmentMap in Cytoscape [42]. Nodes and their periphery represent different gene sets, and the node size represents how many genes are in the gene set. Edges represent mutual overlap.

