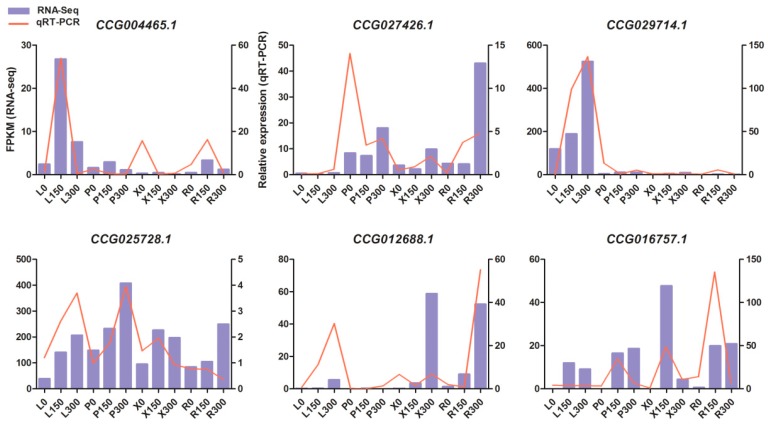
Figure 5.
qRT-PCR (quantitative real-time PCR) verification of six selected DEGs. Comparison of RNA sequencing (RNA-Seq) data (blue bar) with qRT-PCR data (red line). The normalized expression levels (FPKM) from the RNA-Seq results are indicated on the y-axis to the left. The relative qRT-PCR expression level is shown on the y-axis to the right. Actin was used as an internal control. Both methods agree with each other in showing similar gene expression trends.

