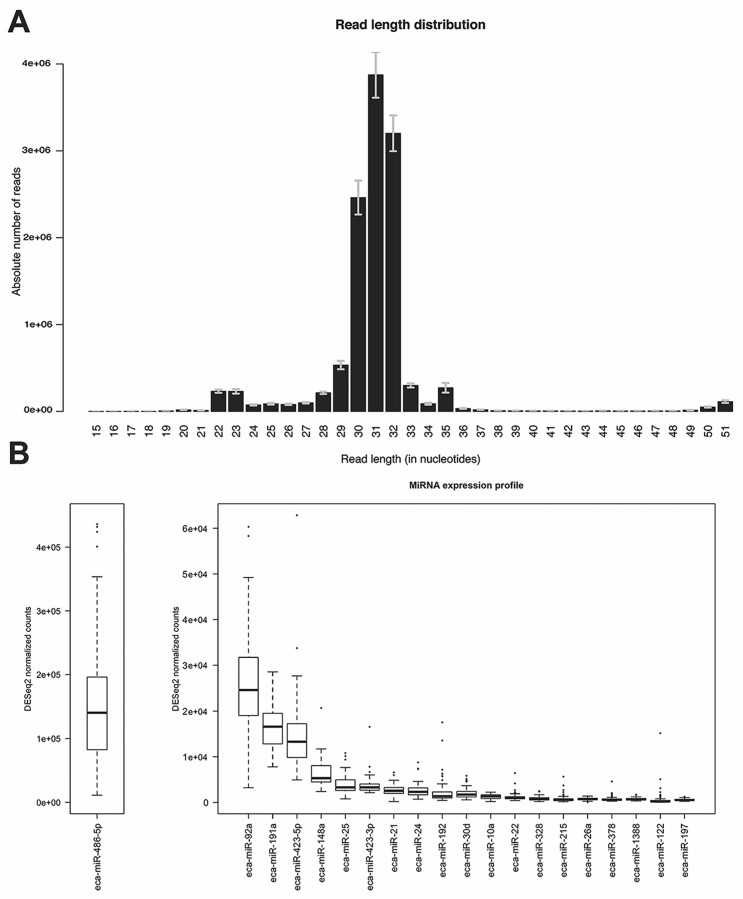
Figure 2.
Read length distribution and miRNA expression profile. (A) Read length distribution after adapter and quality trimming for all 79 samples. The error bars indicate the standard error of the mean; (B) Boxplots of the DESeq2 normalized read counts of the 20 most highly expressed known miRNAs in all samples. For better representation of the data, the top expressed miRNA eca-miR-486-5p is shown in a separate plot with a different scale on the y-axis.

