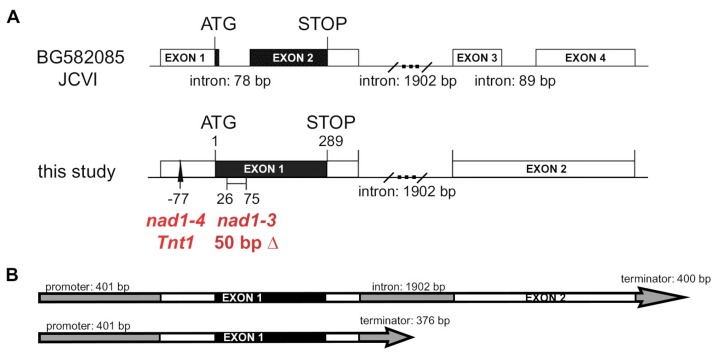
Figure 2.
Gene structure of NAD1 supported by experimental data and position of the mutations in nad1-3 and nad1-4 mutants. (A) The gene structure of NAD1 proposed based on expressed sequence tag BG582085 at JCVI (upper image) and the cDNA sequence identified in this study. Black boxes represent the coding sequences while blank boxes show non-coding exons. The 50-bp deletion in nad1-3 and the Tnt1 insertion in nad1-4 are shown on the cDNA-based gene structure. (B) The schematic presentation of the two constructs used in complementation experiments. The longer construct could completely, while the shorter one could only partially restore the symbiotic phenotype of nad1-3 and nad1-4 mutants (Supplementary Figure S3). Grey bars represent promoter and intron sequences, grey arrows show the terminator regions. Blank bars present exons, while black regions show the coding sequence of NAD1.

