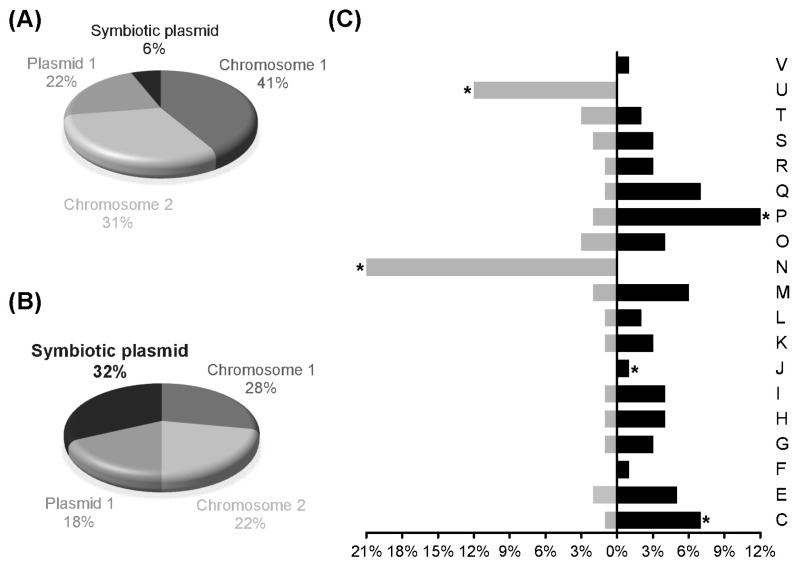
Figure 2.
Analysis of the transcripts differentially expressed during symbiosis of P. phymatum with P. vulgaris. Percentages of the gene distribution among the two chromosomes and two plasmids of the P. phymatum genome (A), and percentages of the 322 genes significantly induced during symbiosis with respect to their encoding chromosomes or plasmids (B). Functional categories of the 500 differentially expressed genes (genes induced in bacteroids shown in black, genes repressed shown in grey) according to the eggNOG annotation (C). The 322 genes used for the calculation of the percentages distribution in (B) were obtained from the analysis performed with the R package DESeq (p-value ≤ 0.01, log2(FC) ≥ 1.6). Asterisks (*) indicate statistical significance for over-represented genes in a particular category (p-value < 0.01).

