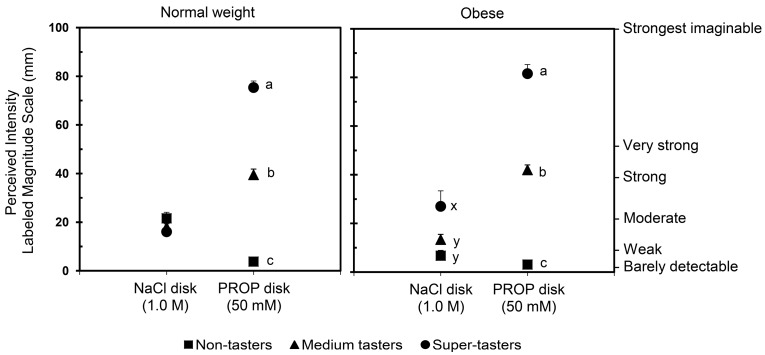
Figure 4.
Mean (±SE) values of perceived intensity NaCl and PROP in an ethnically homogeneous cohort of Sardinia, Italy. n = 134 (48 Males, 86 Females) normal weight subjects; n = 98 (45 Males, 53 Females) obese subjects. Values with different superscripts (a, b, etc.) indicate significant differences (p < 0.034; Duncan’s test subsequent 2-way-ANOVA).

