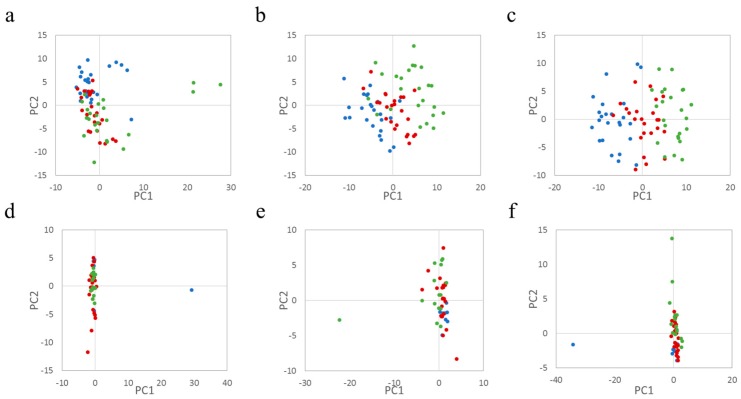
Figure 2.
Principal component analysis of fecal metabolites and the microbiome. Red, blue, and green spheres represent single data points from pretreatment, during treatment, and posttreatment, respectively. Upper panels indicate the results of fecal NMR measurement analyzed by PCA. The data for the experimentally treated mouse groups (a–c) were from the administration of cellulose, Pteridium aquilinum, and Matteuccia struthiopteris, respectively; (d–f) show PCA score plots of the MiSeq data for each group; (d–f) show the results for the microbiota of mice treated with cellulose, P. aquilinum, and M. struthiopteris, respectively. The data analysis was performed using the package “muma” in R [45].

