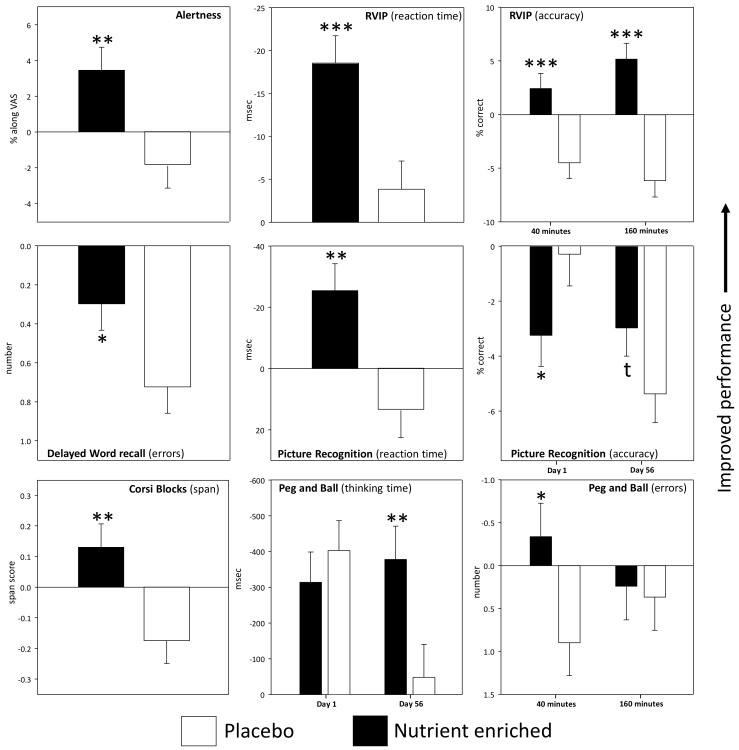
Figure 3.
Effects of the nutrient enriched bars on performance of the tasks and mood scales that were repeated once per assessment. Data are baseline adjusted (to the day’s pre-treatment score) means (±SEM). Asterisks represent a significant difference between treatments in terms of main effects of treatment on the ANOVA or, for those measures that evinced an interaction, from Bonferroni adjusted post-hoc comparisons. * p < 0.05; ** p < 0.01; *** p < 0.001.

