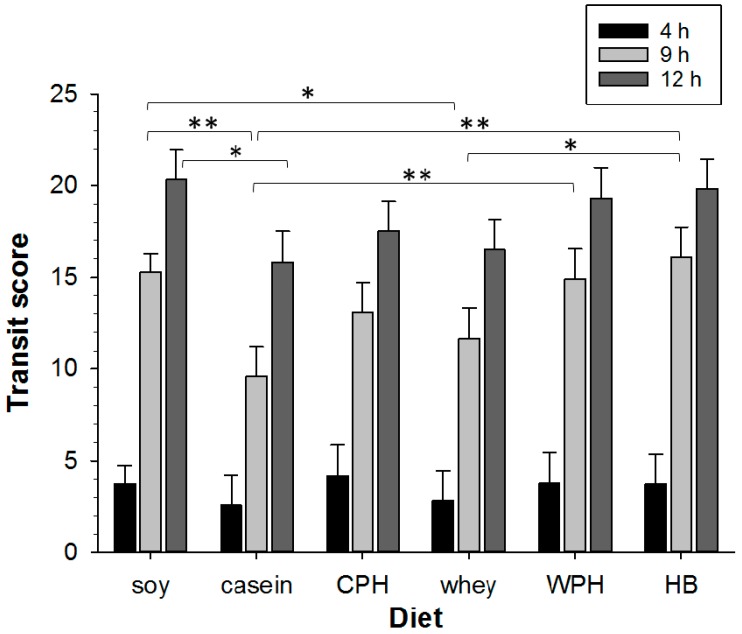
Figure 4.
Comparison of GI transit tracked over 12 h for animals treated with soy or milk protein diets (n = 1–14 animals per group). Transit scores are shown at 4 h (black), 9 h (light grey), and 12 h (dark grey) for: soy, casein, hydrolyzed casein (CPH), whey, hydrolyzed whey (WPH), and hydrolyzed blend (HB). Asterisks indicate the significance of each treatment relative to controls (* p < 0.05; ** p < 0.01). Data show mean ± SEM.

