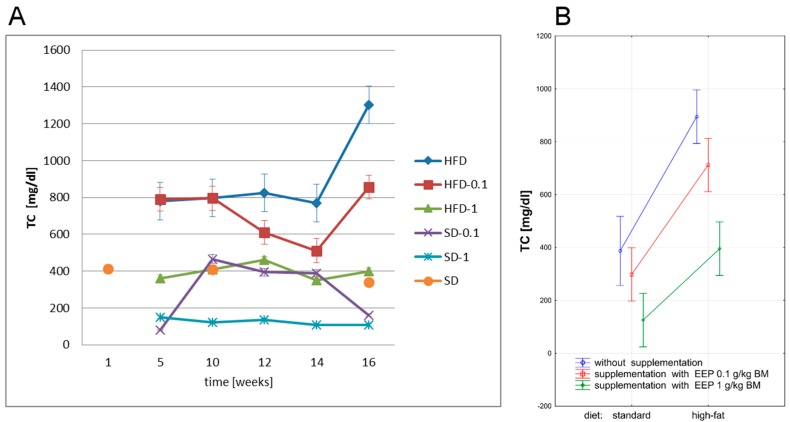
Figure 2.
Total cholesterol (TC) level in ApoE-knockout mice. (A) TC level in particular weeks of the study; (B) Average TC level (n = 10). HFD—high-fat diet; HFD-0.1—high-fat diet supplemented with EEP 0.1 g/kg BM; HFD-1—high-fat diet supplemented with EEP 1 g/kg BM; SD-0.1—standard diet supplemented with EEP 0.1 g/kg BM; SD-1—standard diet supplemented with EEP 1 g/kg BM; SD—standard diet. In HFD-1 group, TC concentration during the total research period corresponded to TC level determined in SD. The lowest TC values were recorded for SD-1.

