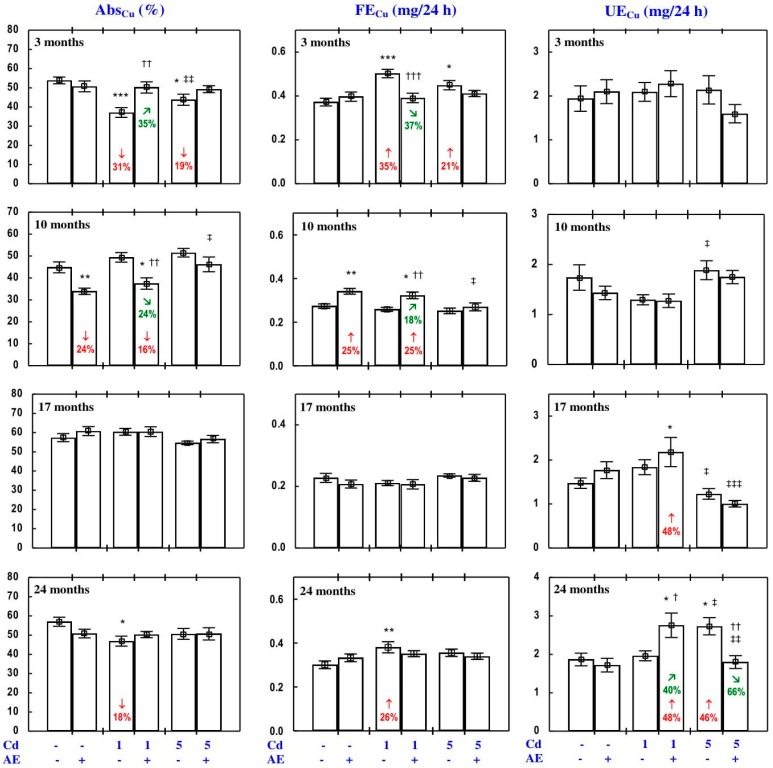
Figure 7.
The apparent absorption of copper (AbsCu) and its daily faecal (FECu) and urinary excretion (UECu) in particular experimental groups. The rats received cadmium (Cd) in their diet at the concentration of 0, 1, and 5 mg/kg and/or 0.1% extract from the berries of Aronia melanocarpa (AE; “+”, received; “-”, not received). Data represent mean ± SE for eight rats (except for seven animals in the AE, Cd1, and Cd5 groups after 24 months). Statistically significant differences (ANOVA, Duncan’s multiple range test): * p < 0.05, ** p < 0.01, *** p < 0.001 vs. control group; † p < 0.05, †† p < 0.01, ††† p < 0.001 vs. respective group receiving Cd alone; ‡ p < 0.05, ‡‡ p < 0.01, ‡‡‡ p < 0.001 vs. respective group receiving the 1 mg Cd/kg diet (alone or with AE) are marked. Numerical values in bars indicate percentage changes compared to the control group (↓, decrease; ↑, increase) or the respective group receiving Cd alone (↘, decrease; ↗, increase).

