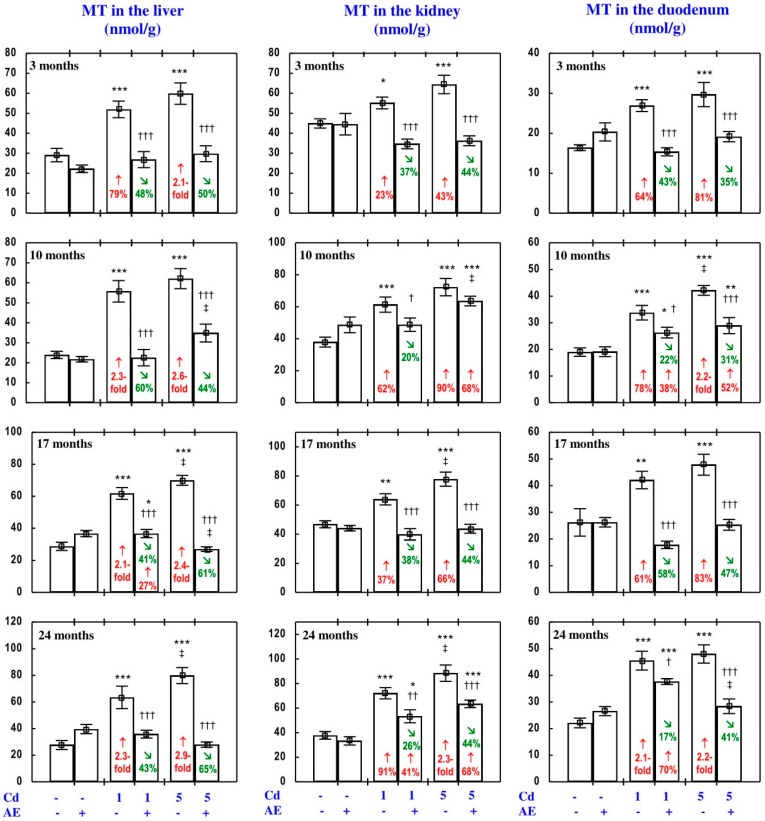
Figure 12.
Metallothionein (MT) concentration in the liver, kidney, and duodenum in particular experimental groups. The rats received cadmium (Cd) in their diet at the concentration of 0, 1, and 5 mg/kg and/or 0.1% extract from the berries of Aronia melanocarpa (AE; “+”, received; “-”, not received). Data represent mean ± SE for eight rats (except for seven animals in the AE, Cd1, and Cd5 groups after 24 months). Statistically significant differences (ANOVA, Duncan’s multiple range test): * p < 0.05, ** p < 0.01, *** p < 0.001 vs. control group; † p < 0.05, †† p < 0.01, ††† p < 0.001 vs. respective group receiving Cd alone; ‡ p < 0.05 vs. respective group receiving the 1 mg Cd/kg diet (alone or with AE) are marked. Numerical values in bars indicate percentage changes or factors of changes compared to the control group (↑, increase) or the respective group receiving Cd alone (↘, decrease).

